Immigrants from Senegal vs Nicaraguan Wage/Income Gap
COMPARE
Immigrants from Senegal
Nicaraguan
Wage/Income Gap
Wage/Income Gap Comparison
Immigrants from Senegal
Nicaraguans
20.9%
WAGE/INCOME GAP
100.0/ 100
METRIC RATING
29th/ 347
METRIC RANK
23.4%
WAGE/INCOME GAP
99.6/ 100
METRIC RATING
90th/ 347
METRIC RANK
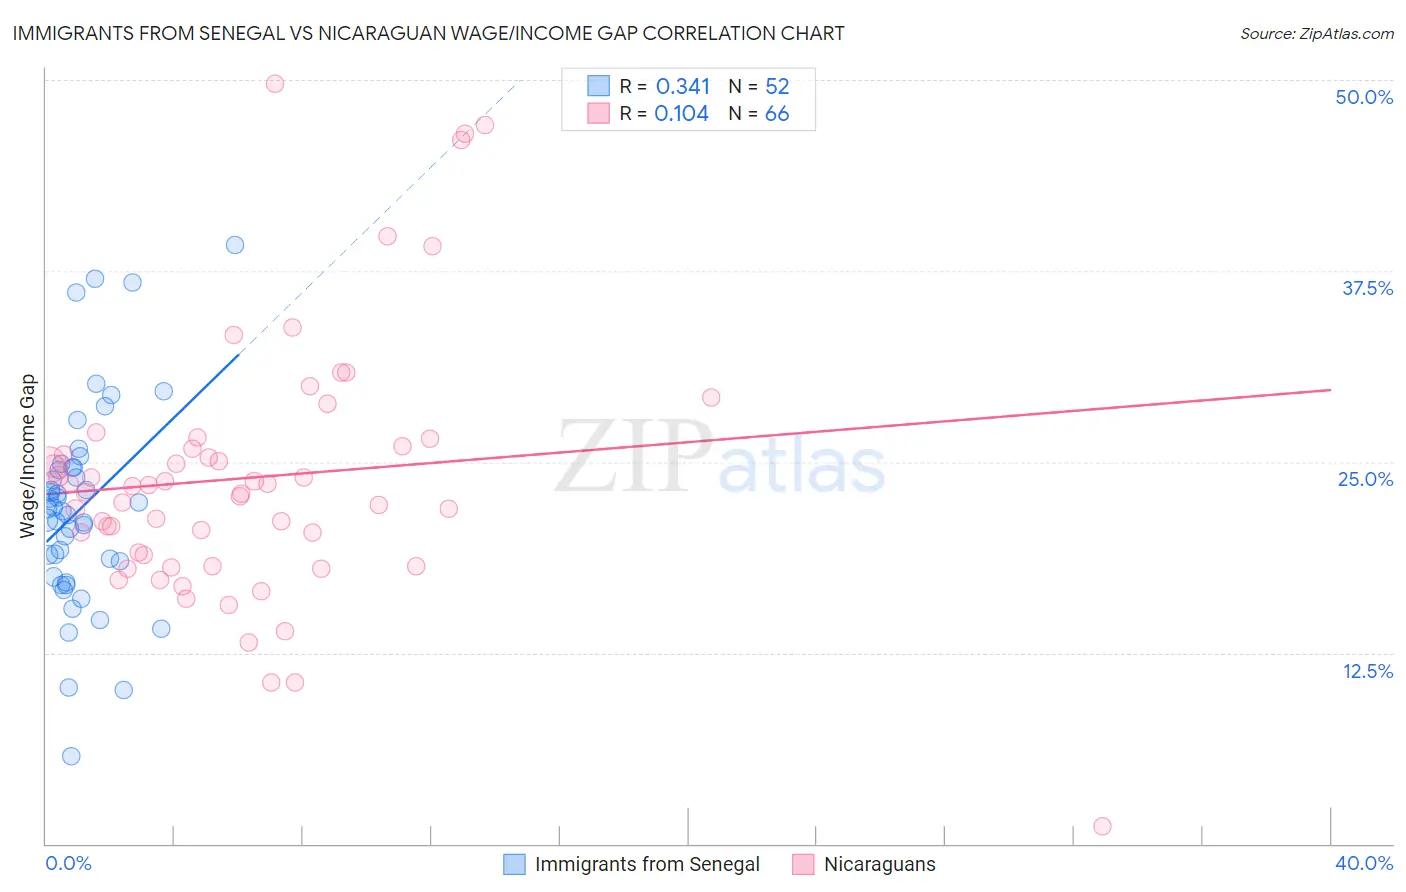
Immigrants from Senegal vs Nicaraguan Wage/Income Gap Correlation Chart
The statistical analysis conducted on geographies consisting of 90,124,089 people shows a mild positive correlation between the proportion of Immigrants from Senegal and wage/income gap percentage in the United States with a correlation coefficient (R) of 0.341 and weighted average of 20.9%. Similarly, the statistical analysis conducted on geographies consisting of 285,636,386 people shows a poor positive correlation between the proportion of Nicaraguans and wage/income gap percentage in the United States with a correlation coefficient (R) of 0.104 and weighted average of 23.4%, a difference of 12.1%.
Wage/Income Gap Correlation Summary
| Measurement | Immigrants from Senegal | Nicaraguan |
| Minimum | 5.7% | 1.2% |
| Maximum | 39.2% | 49.8% |
| Range | 33.4% | 48.6% |
| Mean | 22.0% | 24.0% |
| Median | 21.9% | 23.2% |
| Interquartile 25% (IQ1) | 18.0% | 18.9% |
| Interquartile 75% (IQ3) | 24.6% | 26.0% |
| Interquartile Range (IQR) | 6.6% | 7.1% |
| Standard Deviation (Sample) | 6.6% | 8.6% |
| Standard Deviation (Population) | 6.6% | 8.5% |
Similar Demographics by Wage/Income Gap
Demographics Similar to Immigrants from Senegal by Wage/Income Gap
In terms of wage/income gap, the demographic groups most similar to Immigrants from Senegal are Immigrants from Bangladesh (20.9%, a difference of 0.21%), Vietnamese (21.0%, a difference of 0.49%), Inupiat (20.8%, a difference of 0.62%), Immigrants from Yemen (21.1%, a difference of 0.73%), and Immigrants from Bahamas (21.1%, a difference of 0.74%).
| Demographics | Rating | Rank | Wage/Income Gap |
| Immigrants | Liberia | 100.0 /100 | #22 | Exceptional 20.6% |
| Immigrants | Dominican Republic | 100.0 /100 | #23 | Exceptional 20.6% |
| Dominicans | 100.0 /100 | #24 | Exceptional 20.6% |
| Senegalese | 100.0 /100 | #25 | Exceptional 20.7% |
| Pueblo | 100.0 /100 | #26 | Exceptional 20.7% |
| Immigrants | Armenia | 100.0 /100 | #27 | Exceptional 20.7% |
| Inupiat | 100.0 /100 | #28 | Exceptional 20.8% |
| Immigrants | Senegal | 100.0 /100 | #29 | Exceptional 20.9% |
| Immigrants | Bangladesh | 100.0 /100 | #30 | Exceptional 20.9% |
| Vietnamese | 100.0 /100 | #31 | Exceptional 21.0% |
| Immigrants | Yemen | 100.0 /100 | #32 | Exceptional 21.1% |
| Immigrants | Bahamas | 100.0 /100 | #33 | Exceptional 21.1% |
| Pima | 100.0 /100 | #34 | Exceptional 21.1% |
| Somalis | 100.0 /100 | #35 | Exceptional 21.2% |
| Belizeans | 100.0 /100 | #36 | Exceptional 21.2% |
Demographics Similar to Nicaraguans by Wage/Income Gap
In terms of wage/income gap, the demographic groups most similar to Nicaraguans are Marshallese (23.4%, a difference of 0.010%), Immigrants from Panama (23.4%, a difference of 0.10%), Arapaho (23.5%, a difference of 0.14%), Immigrants from Honduras (23.5%, a difference of 0.29%), and Yuman (23.3%, a difference of 0.42%).
| Demographics | Rating | Rank | Wage/Income Gap |
| Immigrants | Africa | 99.8 /100 | #83 | Exceptional 23.2% |
| Cubans | 99.7 /100 | #84 | Exceptional 23.3% |
| Immigrants | Cambodia | 99.7 /100 | #85 | Exceptional 23.3% |
| Cheyenne | 99.7 /100 | #86 | Exceptional 23.3% |
| Yuman | 99.7 /100 | #87 | Exceptional 23.3% |
| Immigrants | Panama | 99.6 /100 | #88 | Exceptional 23.4% |
| Marshallese | 99.6 /100 | #89 | Exceptional 23.4% |
| Nicaraguans | 99.6 /100 | #90 | Exceptional 23.4% |
| Arapaho | 99.6 /100 | #91 | Exceptional 23.5% |
| Immigrants | Honduras | 99.5 /100 | #92 | Exceptional 23.5% |
| Immigrants | Cabo Verde | 99.5 /100 | #93 | Exceptional 23.6% |
| Hondurans | 99.5 /100 | #94 | Exceptional 23.6% |
| Cape Verdeans | 99.4 /100 | #95 | Exceptional 23.6% |
| Kiowa | 99.4 /100 | #96 | Exceptional 23.6% |
| Immigrants | Sudan | 99.4 /100 | #97 | Exceptional 23.6% |