Hungarian vs Nicaraguan Wage/Income Gap
COMPARE
Hungarian
Nicaraguan
Wage/Income Gap
Wage/Income Gap Comparison
Hungarians
Nicaraguans
29.0%
WAGE/INCOME GAP
0.0/ 100
METRIC RATING
325th/ 347
METRIC RANK
23.4%
WAGE/INCOME GAP
99.6/ 100
METRIC RATING
90th/ 347
METRIC RANK
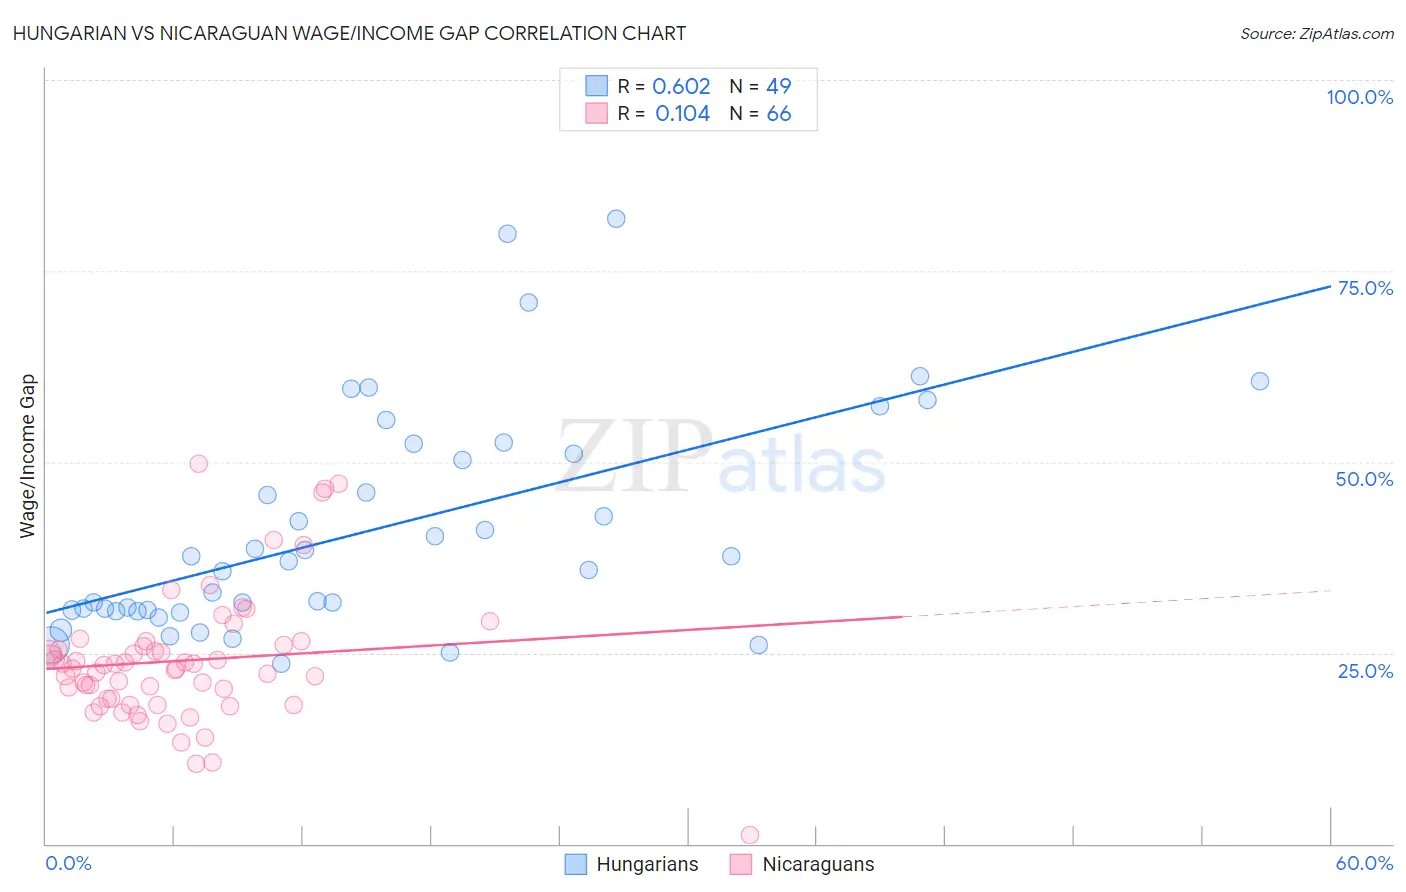
Hungarian vs Nicaraguan Wage/Income Gap Correlation Chart
The statistical analysis conducted on geographies consisting of 485,427,318 people shows a significant positive correlation between the proportion of Hungarians and wage/income gap percentage in the United States with a correlation coefficient (R) of 0.602 and weighted average of 29.0%. Similarly, the statistical analysis conducted on geographies consisting of 285,636,386 people shows a poor positive correlation between the proportion of Nicaraguans and wage/income gap percentage in the United States with a correlation coefficient (R) of 0.104 and weighted average of 23.4%, a difference of 23.9%.
Wage/Income Gap Correlation Summary
| Measurement | Hungarian | Nicaraguan |
| Minimum | 23.5% | 1.2% |
| Maximum | 81.8% | 49.8% |
| Range | 58.3% | 48.6% |
| Mean | 41.1% | 24.0% |
| Median | 37.0% | 23.2% |
| Interquartile 25% (IQ1) | 30.6% | 18.9% |
| Interquartile 75% (IQ3) | 51.8% | 26.0% |
| Interquartile Range (IQR) | 21.2% | 7.1% |
| Standard Deviation (Sample) | 14.5% | 8.6% |
| Standard Deviation (Population) | 14.3% | 8.5% |
Similar Demographics by Wage/Income Gap
Demographics Similar to Hungarians by Wage/Income Gap
In terms of wage/income gap, the demographic groups most similar to Hungarians are Immigrants from Belgium (29.0%, a difference of 0.070%), Croatian (29.0%, a difference of 0.13%), Immigrants from Iran (29.1%, a difference of 0.18%), Scandinavian (29.1%, a difference of 0.24%), and Norwegian (29.0%, a difference of 0.25%).
| Demographics | Rating | Rank | Wage/Income Gap |
| Basques | 0.1 /100 | #318 | Tragic 28.8% |
| Slovaks | 0.1 /100 | #319 | Tragic 28.9% |
| British | 0.1 /100 | #320 | Tragic 28.9% |
| Welsh | 0.1 /100 | #321 | Tragic 28.9% |
| Immigrants | Singapore | 0.1 /100 | #322 | Tragic 28.9% |
| Norwegians | 0.1 /100 | #323 | Tragic 29.0% |
| Croatians | 0.0 /100 | #324 | Tragic 29.0% |
| Hungarians | 0.0 /100 | #325 | Tragic 29.0% |
| Immigrants | Belgium | 0.0 /100 | #326 | Tragic 29.0% |
| Immigrants | Iran | 0.0 /100 | #327 | Tragic 29.1% |
| Scandinavians | 0.0 /100 | #328 | Tragic 29.1% |
| Scottish | 0.0 /100 | #329 | Tragic 29.1% |
| Germans | 0.0 /100 | #330 | Tragic 29.2% |
| Czechs | 0.0 /100 | #331 | Tragic 29.2% |
| Immigrants | South Central Asia | 0.0 /100 | #332 | Tragic 29.3% |
Demographics Similar to Nicaraguans by Wage/Income Gap
In terms of wage/income gap, the demographic groups most similar to Nicaraguans are Marshallese (23.4%, a difference of 0.010%), Immigrants from Panama (23.4%, a difference of 0.10%), Arapaho (23.5%, a difference of 0.14%), Immigrants from Honduras (23.5%, a difference of 0.29%), and Yuman (23.3%, a difference of 0.42%).
| Demographics | Rating | Rank | Wage/Income Gap |
| Immigrants | Africa | 99.8 /100 | #83 | Exceptional 23.2% |
| Cubans | 99.7 /100 | #84 | Exceptional 23.3% |
| Immigrants | Cambodia | 99.7 /100 | #85 | Exceptional 23.3% |
| Cheyenne | 99.7 /100 | #86 | Exceptional 23.3% |
| Yuman | 99.7 /100 | #87 | Exceptional 23.3% |
| Immigrants | Panama | 99.6 /100 | #88 | Exceptional 23.4% |
| Marshallese | 99.6 /100 | #89 | Exceptional 23.4% |
| Nicaraguans | 99.6 /100 | #90 | Exceptional 23.4% |
| Arapaho | 99.6 /100 | #91 | Exceptional 23.5% |
| Immigrants | Honduras | 99.5 /100 | #92 | Exceptional 23.5% |
| Immigrants | Cabo Verde | 99.5 /100 | #93 | Exceptional 23.6% |
| Hondurans | 99.5 /100 | #94 | Exceptional 23.6% |
| Cape Verdeans | 99.4 /100 | #95 | Exceptional 23.6% |
| Kiowa | 99.4 /100 | #96 | Exceptional 23.6% |
| Immigrants | Sudan | 99.4 /100 | #97 | Exceptional 23.6% |