Zip Codes with the Highest Percentage of Population Employed in Arts, Entertainment & Recreation in Mchenry, IL
RELATED REPORTS & OPTIONS
Arts, Entertainment & Recreation
Mchenry
Compare Zip Codes
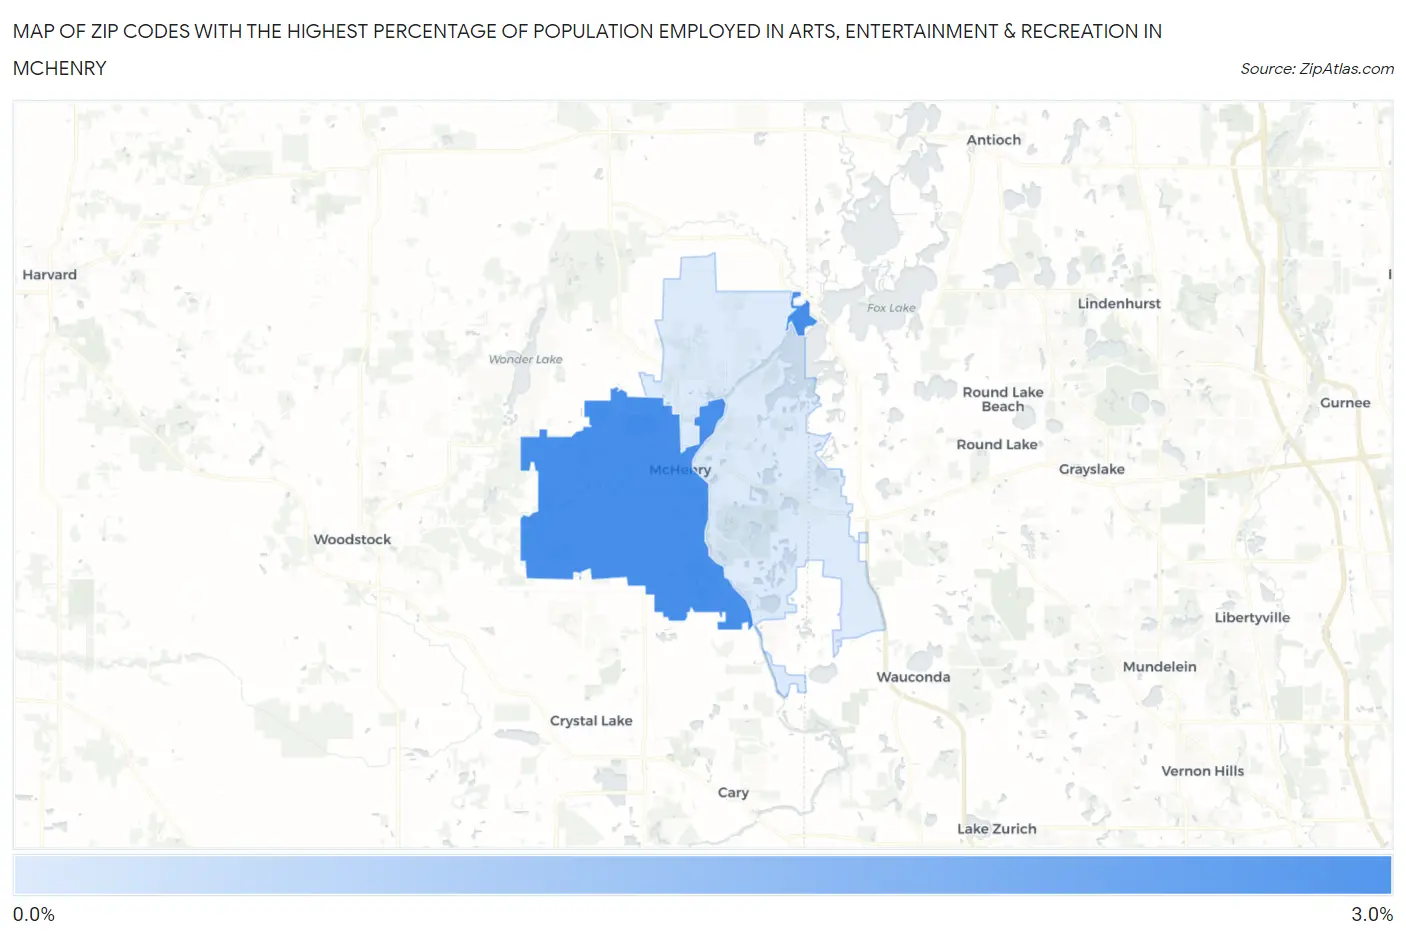
Map of Zip Codes with the Highest Percentage of Population Employed in Arts, Entertainment & Recreation in Mchenry
0.88%
2.6%
Zip Codes with the Highest Percentage of Population Employed in Arts, Entertainment & Recreation in Mchenry, IL
| Zip Code | % Employed | vs State | vs National | |
| 1. | 60050 | 2.6% | 1.9%(+0.652)#195 | 2.1%(+0.504)#6,811 |
| 2. | 60051 | 0.88% | 1.9%(-1.05)#687 | 2.1%(-1.20)#17,810 |
1
Common Questions
What are the Top Zip Codes with the Highest Percentage of Population Employed in Arts, Entertainment & Recreation in Mchenry, IL?
Top Zip Codes with the Highest Percentage of Population Employed in Arts, Entertainment & Recreation in Mchenry, IL are:
What zip code has the Highest Percentage of Population Employed in Arts, Entertainment & Recreation in Mchenry, IL?
60050 has the Highest Percentage of Population Employed in Arts, Entertainment & Recreation in Mchenry, IL with 2.6%.
What is the Percentage of Population Employed in Arts, Entertainment & Recreation in Mchenry, IL?
Percentage of Population Employed in Arts, Entertainment & Recreation in Mchenry is 2.4%.
What is the Percentage of Population Employed in Arts, Entertainment & Recreation in Illinois?
Percentage of Population Employed in Arts, Entertainment & Recreation in Illinois is 1.9%.
What is the Percentage of Population Employed in Arts, Entertainment & Recreation in the United States?
Percentage of Population Employed in Arts, Entertainment & Recreation in the United States is 2.1%.