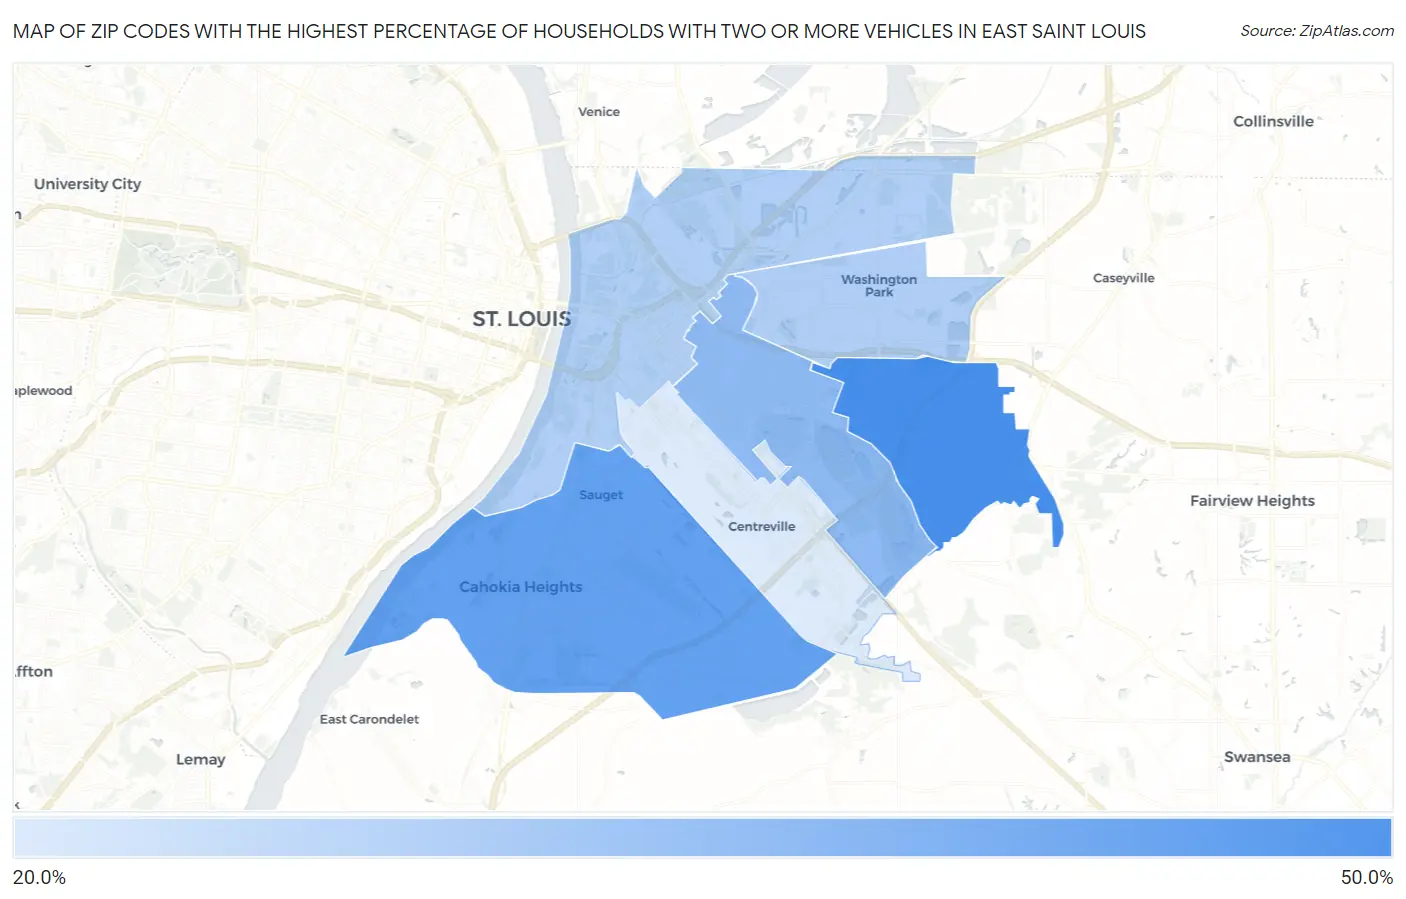
Zip Codes with the Highest Percentage of Households With Two or more Vehicles in East Saint Louis, IL
RELATED REPORTS & OPTIONS
Households with 2 or more Cars
East Saint Louis
Compare Zip Codes
Map of Zip Codes with the Highest Percentage of Households With Two or more Vehicles in East Saint Louis
20.1%
48.1%
Zip Codes with the Highest Percentage of Households With Two or more Vehicles in East Saint Louis, IL
| Zip Code | Housholds With 2+ Cars | vs State | vs National | |
| 1. | 62203 | 48.1% | 54.2%(-6.10)#1,253 | 59.1%(-11.0)#28,701 |
| 2. | 62206 | 42.5% | 54.2%(-11.7)#1,293 | 59.1%(-16.6)#30,029 |
| 3. | 62205 | 33.9% | 54.2%(-20.3)#1,325 | 59.1%(-25.2)#31,165 |
| 4. | 62204 | 28.2% | 54.2%(-26.0)#1,338 | 59.1%(-30.9)#31,592 |
| 5. | 62201 | 27.8% | 54.2%(-26.4)#1,340 | 59.1%(-31.3)#31,620 |
| 6. | 62207 | 20.1% | 54.2%(-34.1)#1,352 | 59.1%(-39.0)#31,991 |
1
Common Questions
What are the Top 5 Zip Codes with the Highest Percentage of Households With Two or more Vehicles in East Saint Louis, IL?
Top 5 Zip Codes with the Highest Percentage of Households With Two or more Vehicles in East Saint Louis, IL are:
What zip code has the Highest Percentage of Households With Two or more Vehicles in East Saint Louis, IL?
62203 has the Highest Percentage of Households With Two or more Vehicles in East Saint Louis, IL with 48.1%.
What is the Percentage of Households With Two or more Vehicles in Illinois?
Percentage of Households With Two or more Vehicles in Illinois is 54.2%.
What is the Percentage of Households With Two or more Vehicles in the United States?
Percentage of Households With Two or more Vehicles in the United States is 59.1%.