White/Caucasian vs Belizean Births to Unmarried Women
COMPARE
White/Caucasian
Belizean
Births to Unmarried Women
Births to Unmarried Women Comparison
Whites/Caucasians
Belizeans
33.3%
BIRTHS TO UNMARRIED WOMEN
10.7/ 100
METRIC RATING
209th/ 347
METRIC RANK
37.0%
BIRTHS TO UNMARRIED WOMEN
0.1/ 100
METRIC RATING
276th/ 347
METRIC RANK
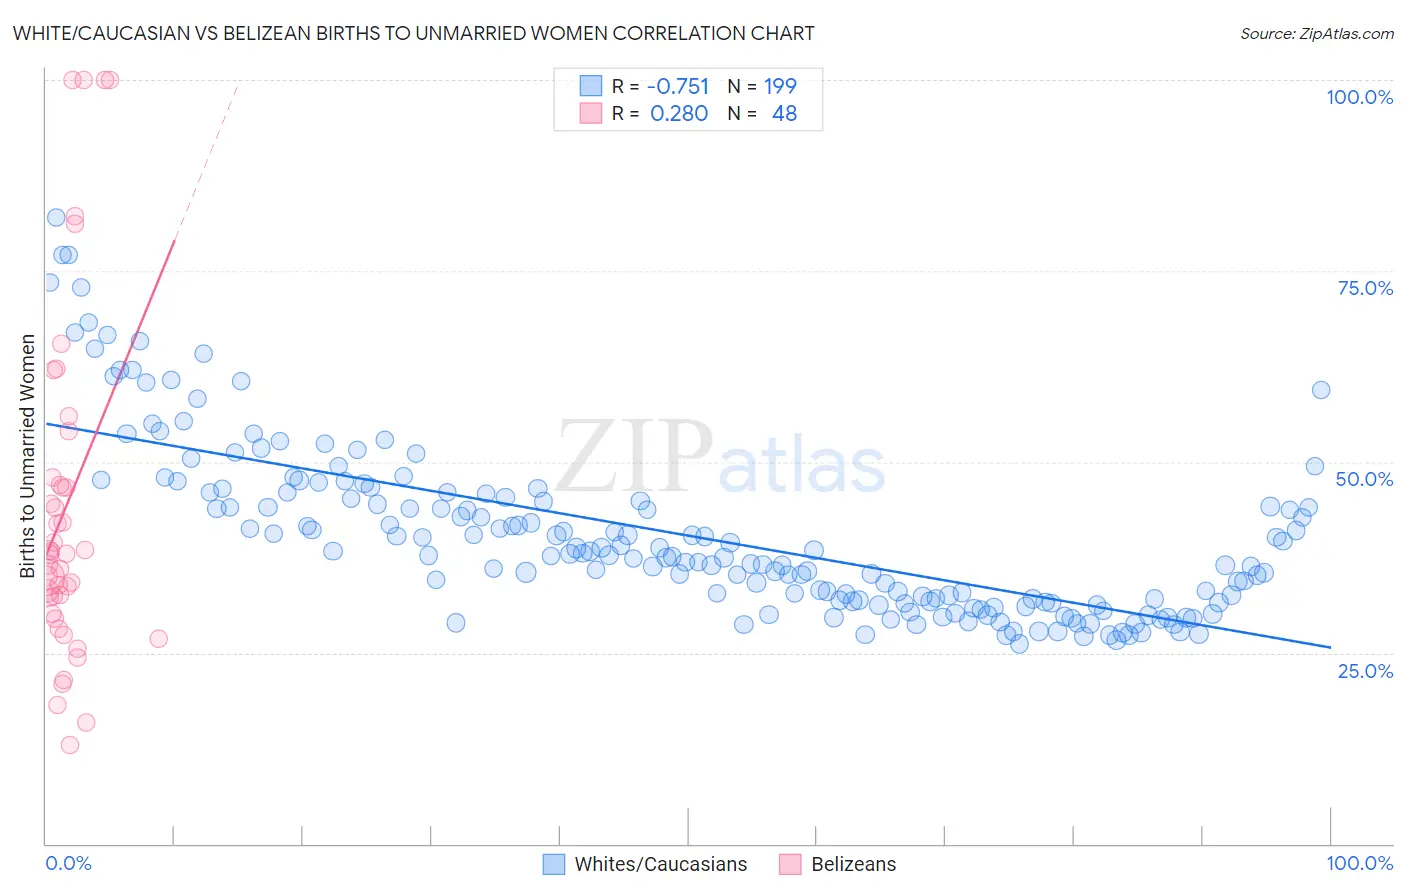
White/Caucasian vs Belizean Births to Unmarried Women Correlation Chart
The statistical analysis conducted on geographies consisting of 513,410,964 people shows a strong negative correlation between the proportion of Whites/Caucasians and percentage of births to unmarried women in the United States with a correlation coefficient (R) of -0.751 and weighted average of 33.3%. Similarly, the statistical analysis conducted on geographies consisting of 141,847,597 people shows a weak positive correlation between the proportion of Belizeans and percentage of births to unmarried women in the United States with a correlation coefficient (R) of 0.280 and weighted average of 37.0%, a difference of 11.4%.
Births to Unmarried Women Correlation Summary
| Measurement | White/Caucasian | Belizean |
| Minimum | 26.1% | 13.0% |
| Maximum | 82.1% | 100.0% |
| Range | 56.0% | 87.0% |
| Mean | 40.4% | 44.0% |
| Median | 37.8% | 38.0% |
| Interquartile 25% (IQ1) | 31.7% | 31.1% |
| Interquartile 75% (IQ3) | 45.8% | 47.5% |
| Interquartile Range (IQR) | 14.1% | 16.3% |
| Standard Deviation (Sample) | 11.2% | 22.4% |
| Standard Deviation (Population) | 11.2% | 22.1% |
Similar Demographics by Births to Unmarried Women
Demographics Similar to Whites/Caucasians by Births to Unmarried Women
In terms of births to unmarried women, the demographic groups most similar to Whites/Caucasians are Scotch-Irish (33.3%, a difference of 0.0%), Ecuadorian (33.3%, a difference of 0.050%), Celtic (33.3%, a difference of 0.12%), Hawaiian (33.2%, a difference of 0.14%), and Immigrants from Sudan (33.2%, a difference of 0.17%).
| Demographics | Rating | Rank | Births to Unmarried Women |
| Immigrants | Micronesia | 16.6 /100 | #202 | Poor 32.9% |
| Ute | 14.4 /100 | #203 | Poor 33.0% |
| Immigrants | Africa | 14.3 /100 | #204 | Poor 33.0% |
| German Russians | 13.1 /100 | #205 | Poor 33.1% |
| Uruguayans | 12.8 /100 | #206 | Poor 33.1% |
| Immigrants | Sudan | 11.5 /100 | #207 | Poor 33.2% |
| Hawaiians | 11.3 /100 | #208 | Poor 33.2% |
| Whites/Caucasians | 10.7 /100 | #209 | Poor 33.3% |
| Scotch-Irish | 10.7 /100 | #210 | Poor 33.3% |
| Ecuadorians | 10.5 /100 | #211 | Poor 33.3% |
| Celtics | 10.2 /100 | #212 | Poor 33.3% |
| Immigrants | Costa Rica | 9.5 /100 | #213 | Tragic 33.4% |
| Slovaks | 9.3 /100 | #214 | Tragic 33.4% |
| French | 8.7 /100 | #215 | Tragic 33.4% |
| Nepalese | 7.8 /100 | #216 | Tragic 33.5% |
Demographics Similar to Belizeans by Births to Unmarried Women
In terms of births to unmarried women, the demographic groups most similar to Belizeans are Barbadian (37.0%, a difference of 0.19%), Cree (37.0%, a difference of 0.22%), Guatemalan (37.1%, a difference of 0.22%), Immigrants from Latin America (37.1%, a difference of 0.30%), and Mexican (36.9%, a difference of 0.31%).
| Demographics | Rating | Rank | Births to Unmarried Women |
| Senegalese | 0.1 /100 | #269 | Tragic 36.8% |
| Immigrants | Congo | 0.1 /100 | #270 | Tragic 36.8% |
| Immigrants | Barbados | 0.1 /100 | #271 | Tragic 36.8% |
| Choctaw | 0.1 /100 | #272 | Tragic 36.9% |
| Mexicans | 0.1 /100 | #273 | Tragic 36.9% |
| Cree | 0.1 /100 | #274 | Tragic 37.0% |
| Barbadians | 0.1 /100 | #275 | Tragic 37.0% |
| Belizeans | 0.1 /100 | #276 | Tragic 37.0% |
| Guatemalans | 0.1 /100 | #277 | Tragic 37.1% |
| Immigrants | Latin America | 0.1 /100 | #278 | Tragic 37.1% |
| West Indians | 0.1 /100 | #279 | Tragic 37.3% |
| Immigrants | St. Vincent and the Grenadines | 0.1 /100 | #280 | Tragic 37.3% |
| Immigrants | Belize | 0.1 /100 | #281 | Tragic 37.3% |
| Liberians | 0.0 /100 | #282 | Tragic 37.4% |
| Spanish American Indians | 0.0 /100 | #283 | Tragic 37.4% |