White/Caucasian vs Shoshone Births to Unmarried Women
COMPARE
White/Caucasian
Shoshone
Births to Unmarried Women
Births to Unmarried Women Comparison
Whites/Caucasians
Shoshone
33.3%
BIRTHS TO UNMARRIED WOMEN
10.7/ 100
METRIC RATING
209th/ 347
METRIC RANK
35.3%
BIRTHS TO UNMARRIED WOMEN
0.8/ 100
METRIC RATING
245th/ 347
METRIC RANK
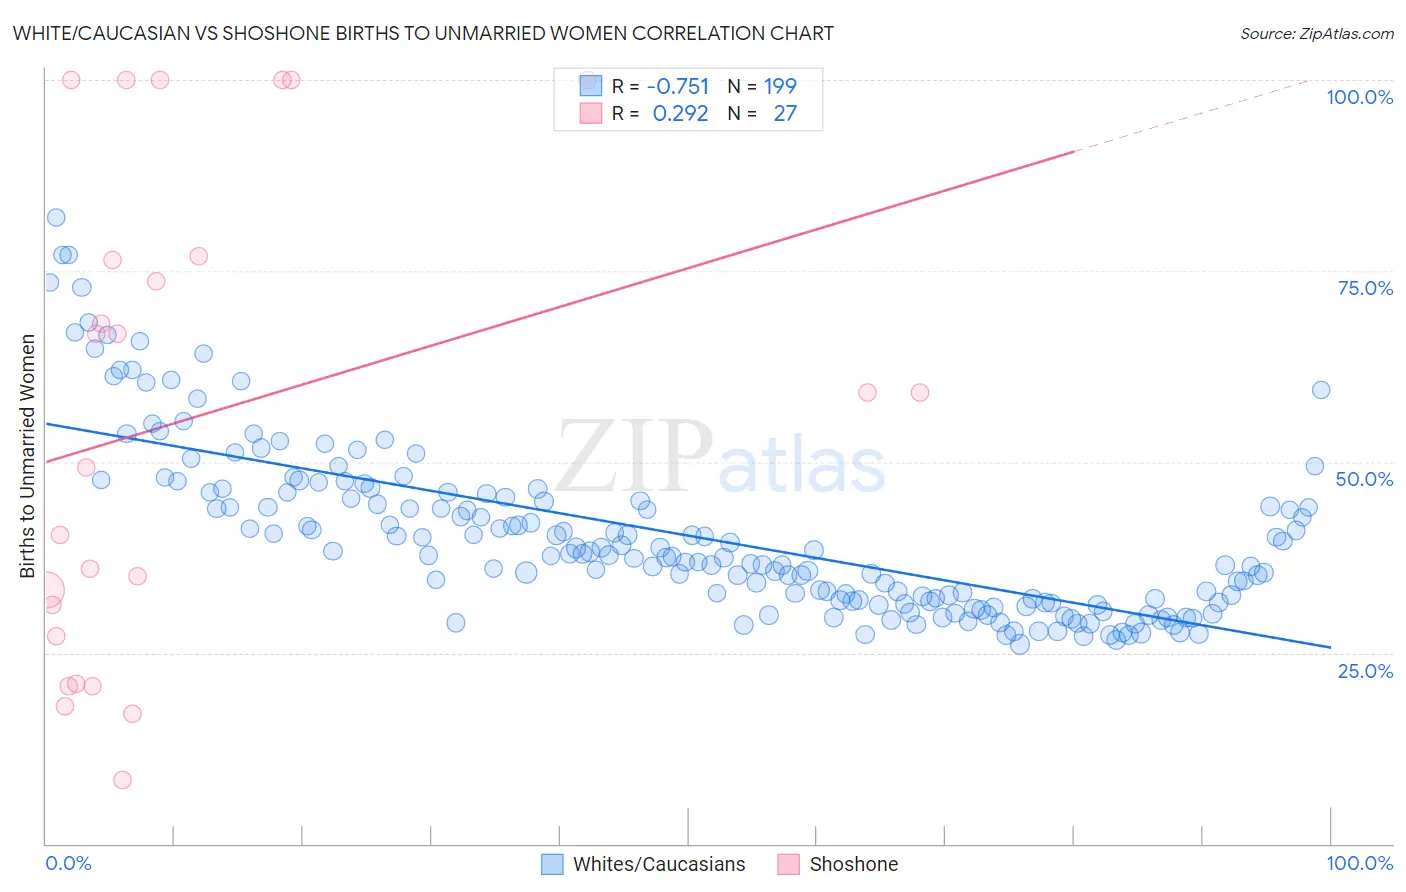
White/Caucasian vs Shoshone Births to Unmarried Women Correlation Chart
The statistical analysis conducted on geographies consisting of 513,410,964 people shows a strong negative correlation between the proportion of Whites/Caucasians and percentage of births to unmarried women in the United States with a correlation coefficient (R) of -0.751 and weighted average of 33.3%. Similarly, the statistical analysis conducted on geographies consisting of 65,659,709 people shows a weak positive correlation between the proportion of Shoshone and percentage of births to unmarried women in the United States with a correlation coefficient (R) of 0.292 and weighted average of 35.3%, a difference of 6.1%.
Births to Unmarried Women Correlation Summary
| Measurement | White/Caucasian | Shoshone |
| Minimum | 26.1% | 8.3% |
| Maximum | 82.1% | 100.0% |
| Range | 56.0% | 91.7% |
| Mean | 40.4% | 55.7% |
| Median | 37.8% | 59.1% |
| Interquartile 25% (IQ1) | 31.7% | 27.2% |
| Interquartile 75% (IQ3) | 45.8% | 76.9% |
| Interquartile Range (IQR) | 14.1% | 49.7% |
| Standard Deviation (Sample) | 11.2% | 31.1% |
| Standard Deviation (Population) | 11.2% | 30.6% |
Similar Demographics by Births to Unmarried Women
Demographics Similar to Whites/Caucasians by Births to Unmarried Women
In terms of births to unmarried women, the demographic groups most similar to Whites/Caucasians are Scotch-Irish (33.3%, a difference of 0.0%), Ecuadorian (33.3%, a difference of 0.050%), Celtic (33.3%, a difference of 0.12%), Hawaiian (33.2%, a difference of 0.14%), and Immigrants from Sudan (33.2%, a difference of 0.17%).
| Demographics | Rating | Rank | Births to Unmarried Women |
| Immigrants | Micronesia | 16.6 /100 | #202 | Poor 32.9% |
| Ute | 14.4 /100 | #203 | Poor 33.0% |
| Immigrants | Africa | 14.3 /100 | #204 | Poor 33.0% |
| German Russians | 13.1 /100 | #205 | Poor 33.1% |
| Uruguayans | 12.8 /100 | #206 | Poor 33.1% |
| Immigrants | Sudan | 11.5 /100 | #207 | Poor 33.2% |
| Hawaiians | 11.3 /100 | #208 | Poor 33.2% |
| Whites/Caucasians | 10.7 /100 | #209 | Poor 33.3% |
| Scotch-Irish | 10.7 /100 | #210 | Poor 33.3% |
| Ecuadorians | 10.5 /100 | #211 | Poor 33.3% |
| Celtics | 10.2 /100 | #212 | Poor 33.3% |
| Immigrants | Costa Rica | 9.5 /100 | #213 | Tragic 33.4% |
| Slovaks | 9.3 /100 | #214 | Tragic 33.4% |
| French | 8.7 /100 | #215 | Tragic 33.4% |
| Nepalese | 7.8 /100 | #216 | Tragic 33.5% |
Demographics Similar to Shoshone by Births to Unmarried Women
In terms of births to unmarried women, the demographic groups most similar to Shoshone are Nigerian (35.3%, a difference of 0.11%), Immigrants from Nigeria (35.4%, a difference of 0.32%), Guyanese (35.2%, a difference of 0.34%), Japanese (35.2%, a difference of 0.40%), and Nonimmigrants (35.5%, a difference of 0.65%).
| Demographics | Rating | Rank | Births to Unmarried Women |
| Immigrants | Cambodia | 1.6 /100 | #238 | Tragic 34.8% |
| Sierra Leoneans | 1.4 /100 | #239 | Tragic 34.9% |
| Immigrants | Middle Africa | 1.2 /100 | #240 | Tragic 34.9% |
| Immigrants | Guyana | 1.2 /100 | #241 | Tragic 35.0% |
| Indonesians | 1.2 /100 | #242 | Tragic 35.0% |
| Japanese | 0.9 /100 | #243 | Tragic 35.2% |
| Guyanese | 0.9 /100 | #244 | Tragic 35.2% |
| Shoshone | 0.8 /100 | #245 | Tragic 35.3% |
| Nigerians | 0.7 /100 | #246 | Tragic 35.3% |
| Immigrants | Nigeria | 0.7 /100 | #247 | Tragic 35.4% |
| Immigrants | Nonimmigrants | 0.6 /100 | #248 | Tragic 35.5% |
| Bermudans | 0.6 /100 | #249 | Tragic 35.5% |
| Mexican American Indians | 0.4 /100 | #250 | Tragic 35.7% |
| Immigrants | Western Africa | 0.3 /100 | #251 | Tragic 36.0% |
| Salvadorans | 0.3 /100 | #252 | Tragic 36.0% |