Spanish vs Immigrants from Honduras Currently Married
COMPARE
Spanish
Immigrants from Honduras
Currently Married
Currently Married Comparison
Spanish
Immigrants from Honduras
47.0%
CURRENTLY MARRIED
68.1/ 100
METRIC RATING
156th/ 347
METRIC RANK
42.2%
CURRENTLY MARRIED
0.0/ 100
METRIC RATING
298th/ 347
METRIC RANK
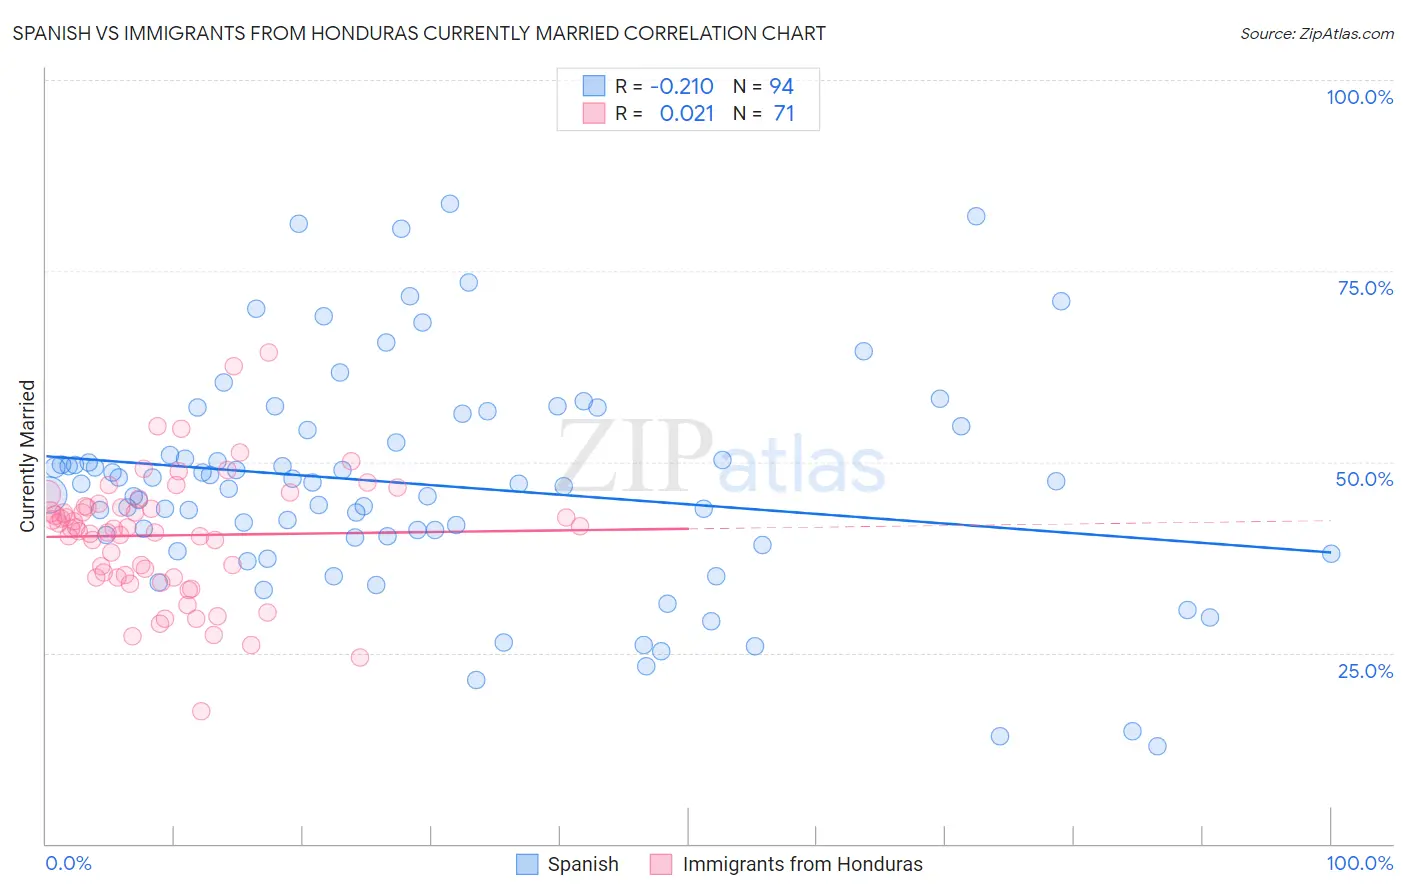
Spanish vs Immigrants from Honduras Currently Married Correlation Chart
The statistical analysis conducted on geographies consisting of 422,154,276 people shows a weak negative correlation between the proportion of Spanish and percentage of population currently married in the United States with a correlation coefficient (R) of -0.210 and weighted average of 47.0%. Similarly, the statistical analysis conducted on geographies consisting of 322,599,872 people shows no correlation between the proportion of Immigrants from Honduras and percentage of population currently married in the United States with a correlation coefficient (R) of 0.021 and weighted average of 42.2%, a difference of 11.2%.
Currently Married Correlation Summary
| Measurement | Spanish | Immigrants from Honduras |
| Minimum | 12.8% | 17.3% |
| Maximum | 83.7% | 64.4% |
| Range | 70.9% | 47.1% |
| Mean | 47.0% | 40.4% |
| Median | 47.2% | 41.2% |
| Interquartile 25% (IQ1) | 40.1% | 34.9% |
| Interquartile 75% (IQ3) | 54.2% | 44.3% |
| Interquartile Range (IQR) | 14.1% | 9.3% |
| Standard Deviation (Sample) | 14.5% | 8.2% |
| Standard Deviation (Population) | 14.4% | 8.1% |
Similar Demographics by Currently Married
Demographics Similar to Spanish by Currently Married
In terms of currently married, the demographic groups most similar to Spanish are Immigrants from Switzerland (46.9%, a difference of 0.010%), Immigrants from Venezuela (47.0%, a difference of 0.020%), Albanian (47.0%, a difference of 0.020%), Arab (47.0%, a difference of 0.020%), and Immigrants from Serbia (47.0%, a difference of 0.030%).
| Demographics | Rating | Rank | Currently Married |
| Zimbabweans | 70.1 /100 | #149 | Good 47.0% |
| Immigrants | Turkey | 70.0 /100 | #150 | Good 47.0% |
| Chileans | 69.8 /100 | #151 | Good 47.0% |
| Immigrants | Serbia | 68.8 /100 | #152 | Good 47.0% |
| Immigrants | Venezuela | 68.6 /100 | #153 | Good 47.0% |
| Albanians | 68.6 /100 | #154 | Good 47.0% |
| Arabs | 68.6 /100 | #155 | Good 47.0% |
| Spanish | 68.1 /100 | #156 | Good 47.0% |
| Immigrants | Switzerland | 67.8 /100 | #157 | Good 46.9% |
| Cherokee | 66.8 /100 | #158 | Good 46.9% |
| Iraqis | 66.4 /100 | #159 | Good 46.9% |
| Immigrants | Uzbekistan | 66.0 /100 | #160 | Good 46.9% |
| Immigrants | Southern Europe | 65.9 /100 | #161 | Good 46.9% |
| Immigrants | Nonimmigrants | 65.4 /100 | #162 | Good 46.9% |
| Delaware | 64.7 /100 | #163 | Good 46.9% |
Demographics Similar to Immigrants from Honduras by Currently Married
In terms of currently married, the demographic groups most similar to Immigrants from Honduras are Liberian (42.2%, a difference of 0.030%), Cheyenne (42.2%, a difference of 0.090%), Belizean (42.2%, a difference of 0.13%), Menominee (42.3%, a difference of 0.20%), and Immigrants from Yemen (42.1%, a difference of 0.37%).
| Demographics | Rating | Rank | Currently Married |
| Immigrants | Guatemala | 0.0 /100 | #291 | Tragic 42.6% |
| Sub-Saharan Africans | 0.0 /100 | #292 | Tragic 42.6% |
| Yuman | 0.0 /100 | #293 | Tragic 42.6% |
| Hondurans | 0.0 /100 | #294 | Tragic 42.5% |
| Immigrants | Western Africa | 0.0 /100 | #295 | Tragic 42.4% |
| Menominee | 0.0 /100 | #296 | Tragic 42.3% |
| Cheyenne | 0.0 /100 | #297 | Tragic 42.2% |
| Immigrants | Honduras | 0.0 /100 | #298 | Tragic 42.2% |
| Liberians | 0.0 /100 | #299 | Tragic 42.2% |
| Belizeans | 0.0 /100 | #300 | Tragic 42.2% |
| Immigrants | Yemen | 0.0 /100 | #301 | Tragic 42.1% |
| Immigrants | Zaire | 0.0 /100 | #302 | Tragic 42.0% |
| Sioux | 0.0 /100 | #303 | Tragic 41.9% |
| Immigrants | Bahamas | 0.0 /100 | #304 | Tragic 41.9% |
| Immigrants | Trinidad and Tobago | 0.0 /100 | #305 | Tragic 41.9% |