Spanish vs Hispanic or Latino Currently Married
COMPARE
Spanish
Hispanic or Latino
Currently Married
Currently Married Comparison
Spanish
Hispanics or Latinos
47.0%
CURRENTLY MARRIED
68.1/ 100
METRIC RATING
156th/ 347
METRIC RANK
44.1%
CURRENTLY MARRIED
0.3/ 100
METRIC RATING
252nd/ 347
METRIC RANK
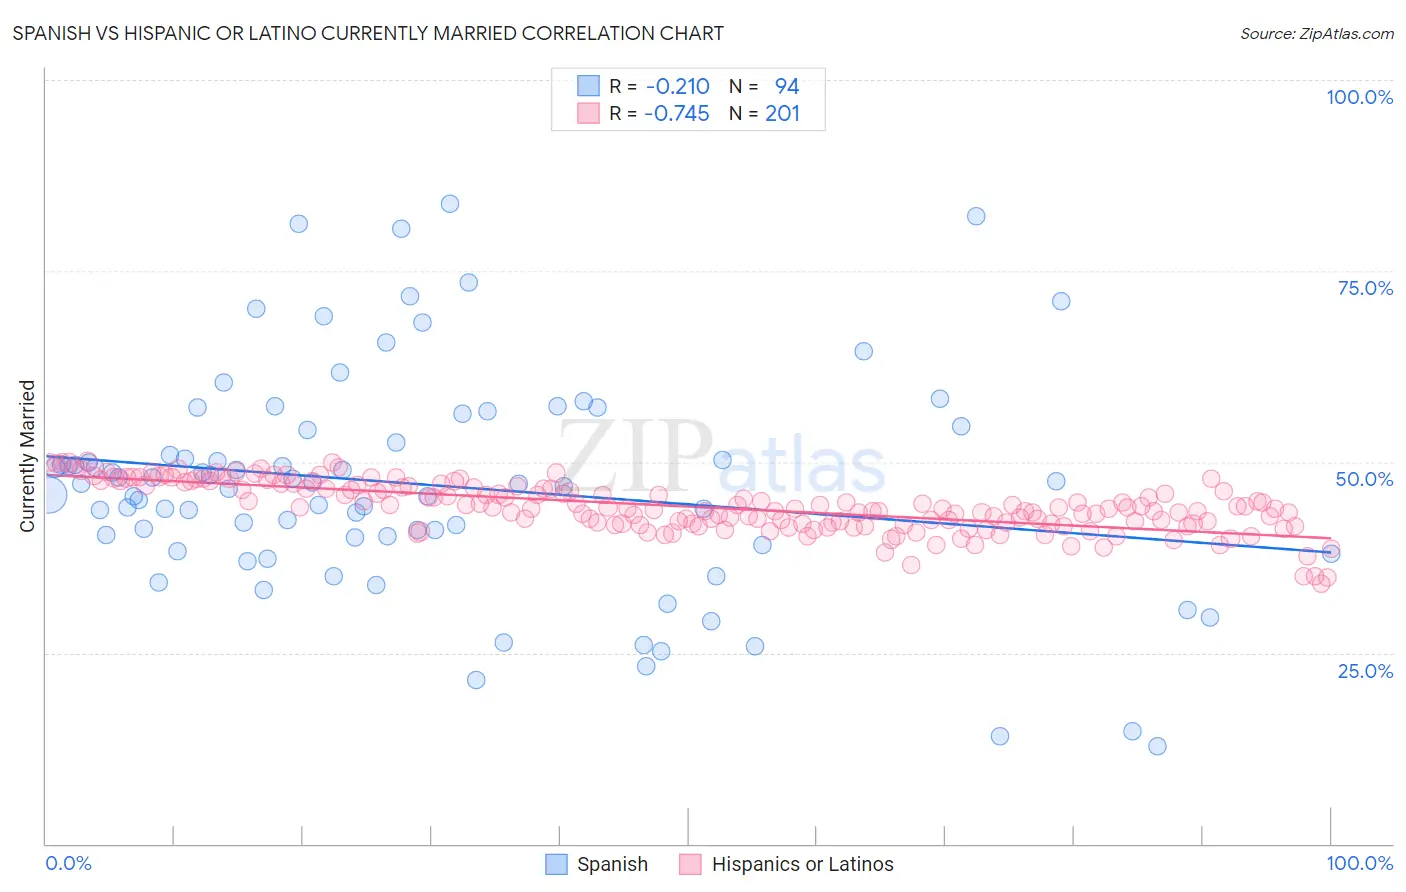
Spanish vs Hispanic or Latino Currently Married Correlation Chart
The statistical analysis conducted on geographies consisting of 422,154,276 people shows a weak negative correlation between the proportion of Spanish and percentage of population currently married in the United States with a correlation coefficient (R) of -0.210 and weighted average of 47.0%. Similarly, the statistical analysis conducted on geographies consisting of 578,461,581 people shows a strong negative correlation between the proportion of Hispanics or Latinos and percentage of population currently married in the United States with a correlation coefficient (R) of -0.745 and weighted average of 44.1%, a difference of 6.4%.
Currently Married Correlation Summary
| Measurement | Spanish | Hispanic or Latino |
| Minimum | 12.8% | 34.1% |
| Maximum | 83.7% | 50.1% |
| Range | 70.9% | 16.0% |
| Mean | 47.0% | 44.1% |
| Median | 47.2% | 44.0% |
| Interquartile 25% (IQ1) | 40.1% | 42.0% |
| Interquartile 75% (IQ3) | 54.2% | 46.8% |
| Interquartile Range (IQR) | 14.1% | 4.8% |
| Standard Deviation (Sample) | 14.5% | 3.2% |
| Standard Deviation (Population) | 14.4% | 3.2% |
Similar Demographics by Currently Married
Demographics Similar to Spanish by Currently Married
In terms of currently married, the demographic groups most similar to Spanish are Immigrants from Switzerland (46.9%, a difference of 0.010%), Immigrants from Venezuela (47.0%, a difference of 0.020%), Albanian (47.0%, a difference of 0.020%), Arab (47.0%, a difference of 0.020%), and Immigrants from Serbia (47.0%, a difference of 0.030%).
| Demographics | Rating | Rank | Currently Married |
| Zimbabweans | 70.1 /100 | #149 | Good 47.0% |
| Immigrants | Turkey | 70.0 /100 | #150 | Good 47.0% |
| Chileans | 69.8 /100 | #151 | Good 47.0% |
| Immigrants | Serbia | 68.8 /100 | #152 | Good 47.0% |
| Immigrants | Venezuela | 68.6 /100 | #153 | Good 47.0% |
| Albanians | 68.6 /100 | #154 | Good 47.0% |
| Arabs | 68.6 /100 | #155 | Good 47.0% |
| Spanish | 68.1 /100 | #156 | Good 47.0% |
| Immigrants | Switzerland | 67.8 /100 | #157 | Good 46.9% |
| Cherokee | 66.8 /100 | #158 | Good 46.9% |
| Iraqis | 66.4 /100 | #159 | Good 46.9% |
| Immigrants | Uzbekistan | 66.0 /100 | #160 | Good 46.9% |
| Immigrants | Southern Europe | 65.9 /100 | #161 | Good 46.9% |
| Immigrants | Nonimmigrants | 65.4 /100 | #162 | Good 46.9% |
| Delaware | 64.7 /100 | #163 | Good 46.9% |
Demographics Similar to Hispanics or Latinos by Currently Married
In terms of currently married, the demographic groups most similar to Hispanics or Latinos are Blackfeet (44.2%, a difference of 0.020%), Immigrants from Central America (44.1%, a difference of 0.030%), Immigrants from Eastern Africa (44.2%, a difference of 0.080%), Immigrants from Cameroon (44.2%, a difference of 0.11%), and Nicaraguan (44.2%, a difference of 0.12%).
| Demographics | Rating | Rank | Currently Married |
| Immigrants | Armenia | 0.4 /100 | #245 | Tragic 44.3% |
| Immigrants | Burma/Myanmar | 0.4 /100 | #246 | Tragic 44.3% |
| Ugandans | 0.4 /100 | #247 | Tragic 44.2% |
| Nicaraguans | 0.3 /100 | #248 | Tragic 44.2% |
| Immigrants | Cameroon | 0.3 /100 | #249 | Tragic 44.2% |
| Immigrants | Eastern Africa | 0.3 /100 | #250 | Tragic 44.2% |
| Blackfeet | 0.3 /100 | #251 | Tragic 44.2% |
| Hispanics or Latinos | 0.3 /100 | #252 | Tragic 44.1% |
| Immigrants | Central America | 0.3 /100 | #253 | Tragic 44.1% |
| Vietnamese | 0.2 /100 | #254 | Tragic 44.0% |
| Yakama | 0.2 /100 | #255 | Tragic 44.0% |
| Shoshone | 0.2 /100 | #256 | Tragic 44.0% |
| Immigrants | Africa | 0.2 /100 | #257 | Tragic 43.9% |
| Ute | 0.2 /100 | #258 | Tragic 43.9% |
| Immigrants | Sierra Leone | 0.1 /100 | #259 | Tragic 43.8% |