Scotch-Irish vs Comanche Births to Unmarried Women
COMPARE
Scotch-Irish
Comanche
Births to Unmarried Women
Births to Unmarried Women Comparison
Scotch-Irish
Comanche
33.3%
BIRTHS TO UNMARRIED WOMEN
10.7/ 100
METRIC RATING
210th/ 347
METRIC RANK
36.7%
BIRTHS TO UNMARRIED WOMEN
0.1/ 100
METRIC RATING
268th/ 347
METRIC RANK
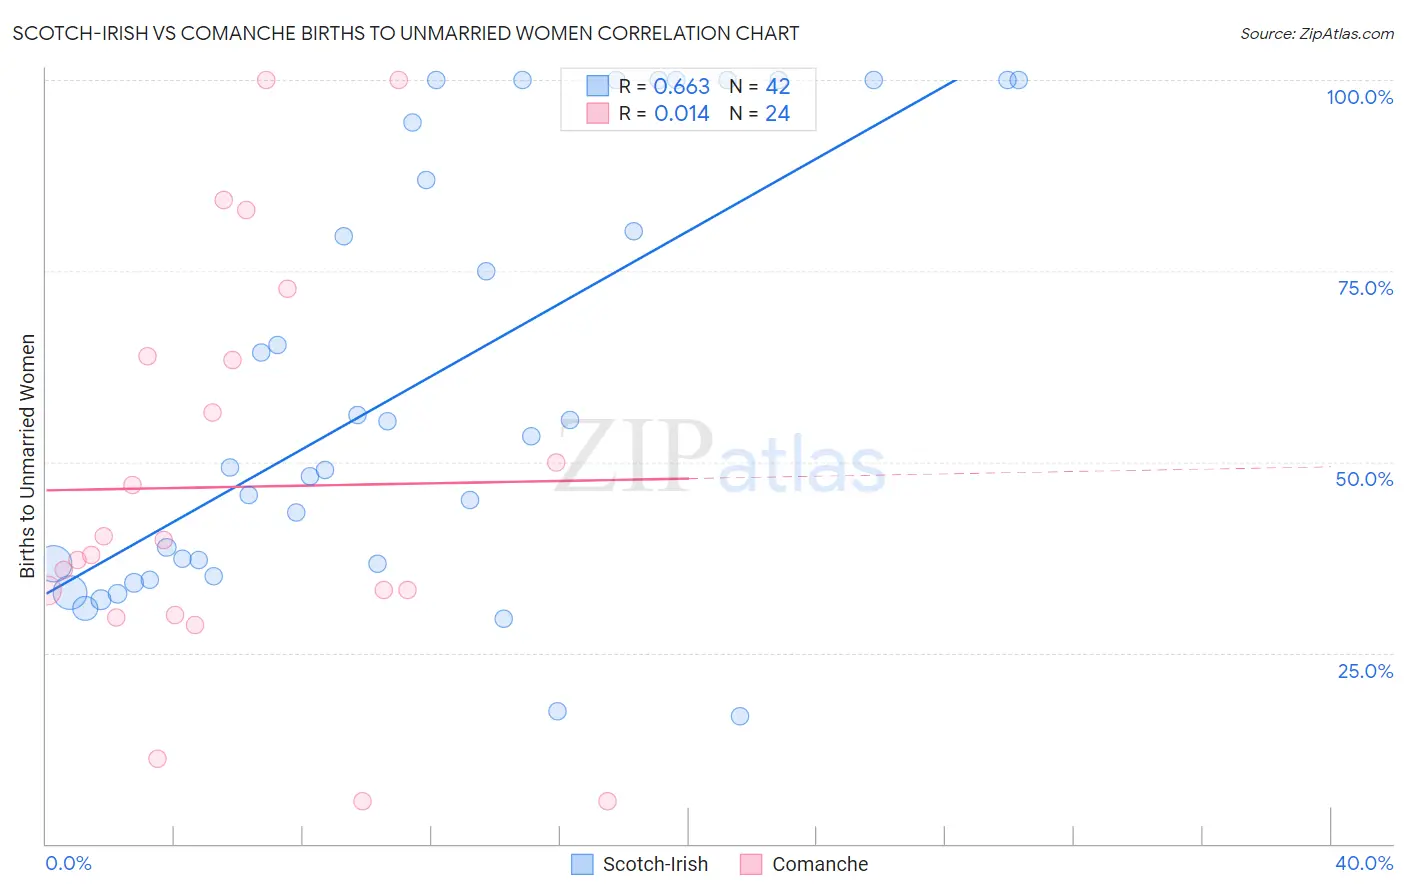
Scotch-Irish vs Comanche Births to Unmarried Women Correlation Chart
The statistical analysis conducted on geographies consisting of 488,755,262 people shows a significant positive correlation between the proportion of Scotch-Irish and percentage of births to unmarried women in the United States with a correlation coefficient (R) of 0.663 and weighted average of 33.3%. Similarly, the statistical analysis conducted on geographies consisting of 107,692,216 people shows no correlation between the proportion of Comanche and percentage of births to unmarried women in the United States with a correlation coefficient (R) of 0.014 and weighted average of 36.7%, a difference of 10.4%.
Births to Unmarried Women Correlation Summary
| Measurement | Scotch-Irish | Comanche |
| Minimum | 16.7% | 5.6% |
| Maximum | 100.0% | 100.0% |
| Range | 83.3% | 94.4% |
| Mean | 60.2% | 46.7% |
| Median | 51.3% | 38.8% |
| Interquartile 25% (IQ1) | 36.6% | 31.6% |
| Interquartile 75% (IQ3) | 94.4% | 63.6% |
| Interquartile Range (IQR) | 57.8% | 32.0% |
| Standard Deviation (Sample) | 28.1% | 26.6% |
| Standard Deviation (Population) | 27.8% | 26.0% |
Similar Demographics by Births to Unmarried Women
Demographics Similar to Scotch-Irish by Births to Unmarried Women
In terms of births to unmarried women, the demographic groups most similar to Scotch-Irish are White/Caucasian (33.3%, a difference of 0.0%), Ecuadorian (33.3%, a difference of 0.050%), Celtic (33.3%, a difference of 0.12%), Hawaiian (33.2%, a difference of 0.14%), and Immigrants from Sudan (33.2%, a difference of 0.17%).
| Demographics | Rating | Rank | Births to Unmarried Women |
| Ute | 14.4 /100 | #203 | Poor 33.0% |
| Immigrants | Africa | 14.3 /100 | #204 | Poor 33.0% |
| German Russians | 13.1 /100 | #205 | Poor 33.1% |
| Uruguayans | 12.8 /100 | #206 | Poor 33.1% |
| Immigrants | Sudan | 11.5 /100 | #207 | Poor 33.2% |
| Hawaiians | 11.3 /100 | #208 | Poor 33.2% |
| Whites/Caucasians | 10.7 /100 | #209 | Poor 33.3% |
| Scotch-Irish | 10.7 /100 | #210 | Poor 33.3% |
| Ecuadorians | 10.5 /100 | #211 | Poor 33.3% |
| Celtics | 10.2 /100 | #212 | Poor 33.3% |
| Immigrants | Costa Rica | 9.5 /100 | #213 | Tragic 33.4% |
| Slovaks | 9.3 /100 | #214 | Tragic 33.4% |
| French | 8.7 /100 | #215 | Tragic 33.4% |
| Nepalese | 7.8 /100 | #216 | Tragic 33.5% |
| Spaniards | 7.0 /100 | #217 | Tragic 33.6% |
Demographics Similar to Comanche by Births to Unmarried Women
In terms of births to unmarried women, the demographic groups most similar to Comanche are Central American (36.7%, a difference of 0.010%), Immigrants from Senegal (36.7%, a difference of 0.080%), Senegalese (36.8%, a difference of 0.12%), Cherokee (36.7%, a difference of 0.13%), and Subsaharan African (36.7%, a difference of 0.18%).
| Demographics | Rating | Rank | Births to Unmarried Women |
| Trinidadians and Tobagonians | 0.2 /100 | #261 | Tragic 36.5% |
| French American Indians | 0.1 /100 | #262 | Tragic 36.6% |
| Nicaraguans | 0.1 /100 | #263 | Tragic 36.6% |
| Sub-Saharan Africans | 0.1 /100 | #264 | Tragic 36.7% |
| Cherokee | 0.1 /100 | #265 | Tragic 36.7% |
| Immigrants | Senegal | 0.1 /100 | #266 | Tragic 36.7% |
| Central Americans | 0.1 /100 | #267 | Tragic 36.7% |
| Comanche | 0.1 /100 | #268 | Tragic 36.7% |
| Senegalese | 0.1 /100 | #269 | Tragic 36.8% |
| Immigrants | Congo | 0.1 /100 | #270 | Tragic 36.8% |
| Immigrants | Barbados | 0.1 /100 | #271 | Tragic 36.8% |
| Choctaw | 0.1 /100 | #272 | Tragic 36.9% |
| Mexicans | 0.1 /100 | #273 | Tragic 36.9% |
| Cree | 0.1 /100 | #274 | Tragic 37.0% |
| Barbadians | 0.1 /100 | #275 | Tragic 37.0% |