Immigrants from Indonesia vs Comanche Births to Unmarried Women
COMPARE
Immigrants from Indonesia
Comanche
Births to Unmarried Women
Births to Unmarried Women Comparison
Immigrants from Indonesia
Comanche
27.7%
BIRTHS TO UNMARRIED WOMEN
99.5/ 100
METRIC RATING
44th/ 347
METRIC RANK
36.7%
BIRTHS TO UNMARRIED WOMEN
0.1/ 100
METRIC RATING
268th/ 347
METRIC RANK
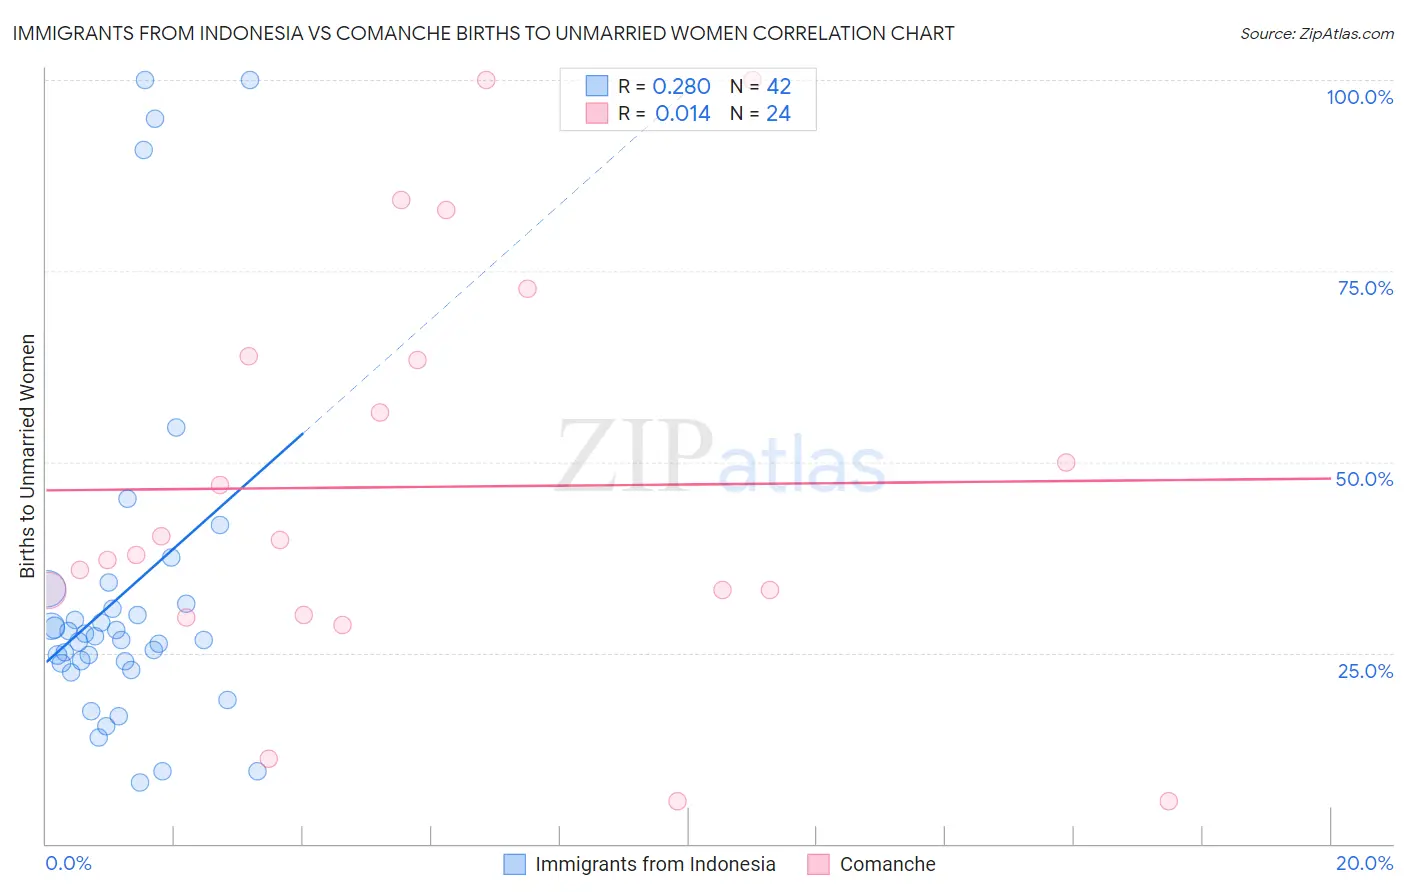
Immigrants from Indonesia vs Comanche Births to Unmarried Women Correlation Chart
The statistical analysis conducted on geographies consisting of 207,082,452 people shows a weak positive correlation between the proportion of Immigrants from Indonesia and percentage of births to unmarried women in the United States with a correlation coefficient (R) of 0.280 and weighted average of 27.7%. Similarly, the statistical analysis conducted on geographies consisting of 107,692,216 people shows no correlation between the proportion of Comanche and percentage of births to unmarried women in the United States with a correlation coefficient (R) of 0.014 and weighted average of 36.7%, a difference of 32.6%.
Births to Unmarried Women Correlation Summary
| Measurement | Immigrants from Indonesia | Comanche |
| Minimum | 8.0% | 5.6% |
| Maximum | 100.0% | 100.0% |
| Range | 92.0% | 94.4% |
| Mean | 32.9% | 46.7% |
| Median | 27.0% | 38.8% |
| Interquartile 25% (IQ1) | 23.6% | 31.6% |
| Interquartile 75% (IQ3) | 31.5% | 63.6% |
| Interquartile Range (IQR) | 7.9% | 32.0% |
| Standard Deviation (Sample) | 22.7% | 26.6% |
| Standard Deviation (Population) | 22.4% | 26.0% |
Similar Demographics by Births to Unmarried Women
Demographics Similar to Immigrants from Indonesia by Births to Unmarried Women
In terms of births to unmarried women, the demographic groups most similar to Immigrants from Indonesia are Latvian (27.7%, a difference of 0.090%), Immigrants from Lithuania (27.7%, a difference of 0.14%), Hmong (27.7%, a difference of 0.14%), Eastern European (27.7%, a difference of 0.15%), and Immigrants from Bulgaria (27.6%, a difference of 0.26%).
| Demographics | Rating | Rank | Births to Unmarried Women |
| Immigrants | Ukraine | 99.7 /100 | #37 | Exceptional 27.2% |
| Immigrants | Moldova | 99.7 /100 | #38 | Exceptional 27.3% |
| Immigrants | Malaysia | 99.7 /100 | #39 | Exceptional 27.4% |
| Turks | 99.6 /100 | #40 | Exceptional 27.4% |
| Iraqis | 99.6 /100 | #41 | Exceptional 27.6% |
| Immigrants | Eastern Europe | 99.6 /100 | #42 | Exceptional 27.6% |
| Immigrants | Bulgaria | 99.6 /100 | #43 | Exceptional 27.6% |
| Immigrants | Indonesia | 99.5 /100 | #44 | Exceptional 27.7% |
| Latvians | 99.5 /100 | #45 | Exceptional 27.7% |
| Immigrants | Lithuania | 99.5 /100 | #46 | Exceptional 27.7% |
| Hmong | 99.5 /100 | #47 | Exceptional 27.7% |
| Eastern Europeans | 99.5 /100 | #48 | Exceptional 27.7% |
| Immigrants | Greece | 99.4 /100 | #49 | Exceptional 27.8% |
| Maltese | 99.4 /100 | #50 | Exceptional 27.8% |
| Macedonians | 99.4 /100 | #51 | Exceptional 27.9% |
Demographics Similar to Comanche by Births to Unmarried Women
In terms of births to unmarried women, the demographic groups most similar to Comanche are Central American (36.7%, a difference of 0.010%), Immigrants from Senegal (36.7%, a difference of 0.080%), Senegalese (36.8%, a difference of 0.12%), Cherokee (36.7%, a difference of 0.13%), and Subsaharan African (36.7%, a difference of 0.18%).
| Demographics | Rating | Rank | Births to Unmarried Women |
| Trinidadians and Tobagonians | 0.2 /100 | #261 | Tragic 36.5% |
| French American Indians | 0.1 /100 | #262 | Tragic 36.6% |
| Nicaraguans | 0.1 /100 | #263 | Tragic 36.6% |
| Sub-Saharan Africans | 0.1 /100 | #264 | Tragic 36.7% |
| Cherokee | 0.1 /100 | #265 | Tragic 36.7% |
| Immigrants | Senegal | 0.1 /100 | #266 | Tragic 36.7% |
| Central Americans | 0.1 /100 | #267 | Tragic 36.7% |
| Comanche | 0.1 /100 | #268 | Tragic 36.7% |
| Senegalese | 0.1 /100 | #269 | Tragic 36.8% |
| Immigrants | Congo | 0.1 /100 | #270 | Tragic 36.8% |
| Immigrants | Barbados | 0.1 /100 | #271 | Tragic 36.8% |
| Choctaw | 0.1 /100 | #272 | Tragic 36.9% |
| Mexicans | 0.1 /100 | #273 | Tragic 36.9% |
| Cree | 0.1 /100 | #274 | Tragic 37.0% |
| Barbadians | 0.1 /100 | #275 | Tragic 37.0% |