Scotch-Irish vs Yugoslavian Births to Unmarried Women
COMPARE
Scotch-Irish
Yugoslavian
Births to Unmarried Women
Births to Unmarried Women Comparison
Scotch-Irish
Yugoslavians
33.3%
BIRTHS TO UNMARRIED WOMEN
10.7/ 100
METRIC RATING
210th/ 347
METRIC RANK
30.8%
BIRTHS TO UNMARRIED WOMEN
75.1/ 100
METRIC RATING
154th/ 347
METRIC RANK
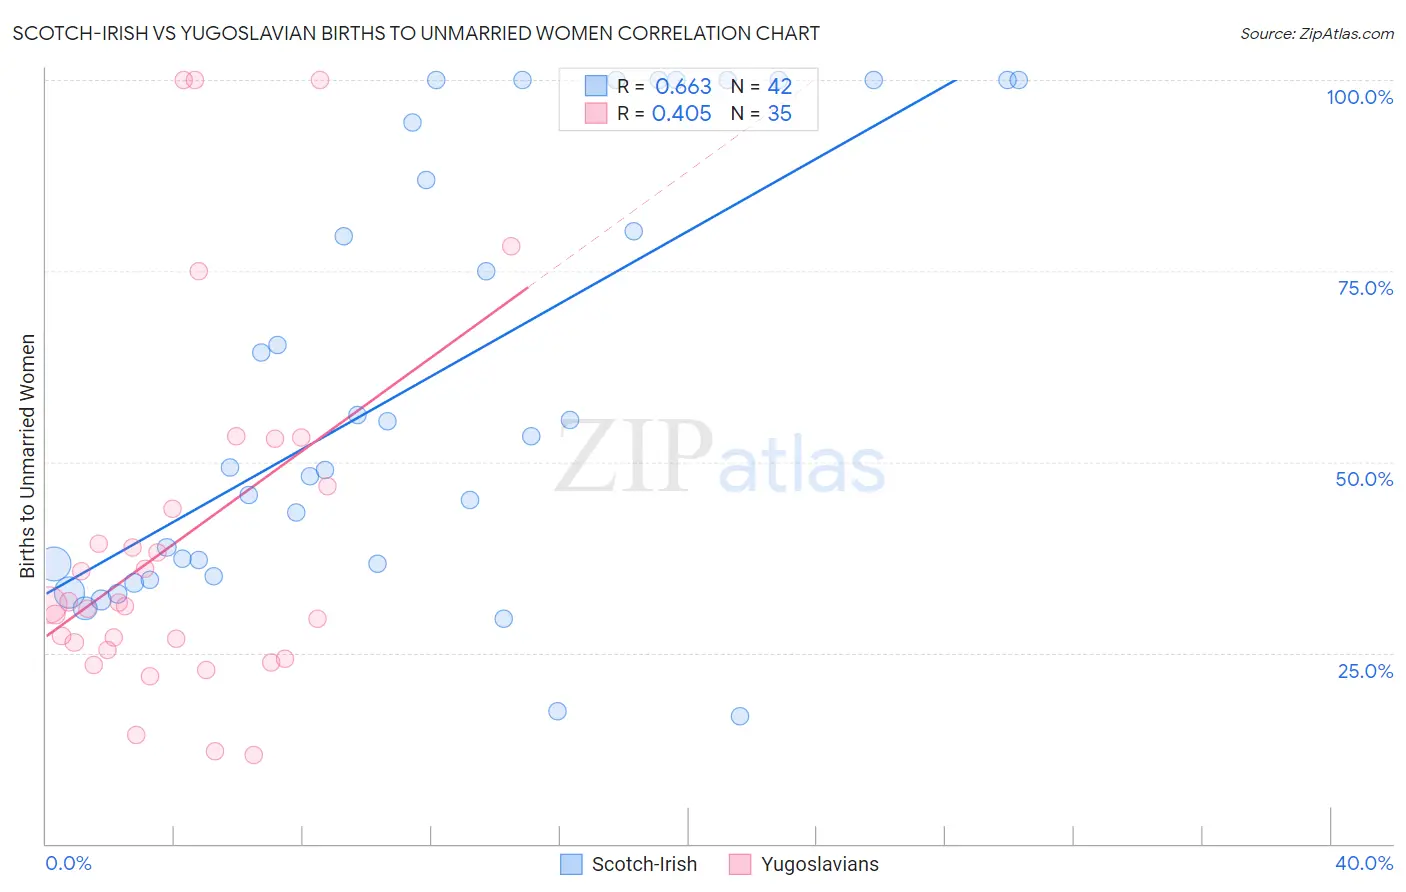
Scotch-Irish vs Yugoslavian Births to Unmarried Women Correlation Chart
The statistical analysis conducted on geographies consisting of 488,755,262 people shows a significant positive correlation between the proportion of Scotch-Irish and percentage of births to unmarried women in the United States with a correlation coefficient (R) of 0.663 and weighted average of 33.3%. Similarly, the statistical analysis conducted on geographies consisting of 270,567,772 people shows a moderate positive correlation between the proportion of Yugoslavians and percentage of births to unmarried women in the United States with a correlation coefficient (R) of 0.405 and weighted average of 30.8%, a difference of 7.8%.
Births to Unmarried Women Correlation Summary
| Measurement | Scotch-Irish | Yugoslavian |
| Minimum | 16.7% | 11.7% |
| Maximum | 100.0% | 100.0% |
| Range | 83.3% | 88.3% |
| Mean | 60.2% | 39.8% |
| Median | 51.3% | 31.3% |
| Interquartile 25% (IQ1) | 36.6% | 25.4% |
| Interquartile 75% (IQ3) | 94.4% | 46.8% |
| Interquartile Range (IQR) | 57.8% | 21.4% |
| Standard Deviation (Sample) | 28.1% | 23.8% |
| Standard Deviation (Population) | 27.8% | 23.5% |
Similar Demographics by Births to Unmarried Women
Demographics Similar to Scotch-Irish by Births to Unmarried Women
In terms of births to unmarried women, the demographic groups most similar to Scotch-Irish are White/Caucasian (33.3%, a difference of 0.0%), Ecuadorian (33.3%, a difference of 0.050%), Celtic (33.3%, a difference of 0.12%), Hawaiian (33.2%, a difference of 0.14%), and Immigrants from Sudan (33.2%, a difference of 0.17%).
| Demographics | Rating | Rank | Births to Unmarried Women |
| Ute | 14.4 /100 | #203 | Poor 33.0% |
| Immigrants | Africa | 14.3 /100 | #204 | Poor 33.0% |
| German Russians | 13.1 /100 | #205 | Poor 33.1% |
| Uruguayans | 12.8 /100 | #206 | Poor 33.1% |
| Immigrants | Sudan | 11.5 /100 | #207 | Poor 33.2% |
| Hawaiians | 11.3 /100 | #208 | Poor 33.2% |
| Whites/Caucasians | 10.7 /100 | #209 | Poor 33.3% |
| Scotch-Irish | 10.7 /100 | #210 | Poor 33.3% |
| Ecuadorians | 10.5 /100 | #211 | Poor 33.3% |
| Celtics | 10.2 /100 | #212 | Poor 33.3% |
| Immigrants | Costa Rica | 9.5 /100 | #213 | Tragic 33.4% |
| Slovaks | 9.3 /100 | #214 | Tragic 33.4% |
| French | 8.7 /100 | #215 | Tragic 33.4% |
| Nepalese | 7.8 /100 | #216 | Tragic 33.5% |
| Spaniards | 7.0 /100 | #217 | Tragic 33.6% |
Demographics Similar to Yugoslavians by Births to Unmarried Women
In terms of births to unmarried women, the demographic groups most similar to Yugoslavians are British (30.8%, a difference of 0.12%), Polish (30.8%, a difference of 0.14%), Immigrants from Bangladesh (30.9%, a difference of 0.15%), Carpatho Rusyn (30.9%, a difference of 0.20%), and Italian (30.8%, a difference of 0.25%).
| Demographics | Rating | Rank | Births to Unmarried Women |
| Immigrants | Oceania | 81.2 /100 | #147 | Excellent 30.6% |
| Chileans | 79.1 /100 | #148 | Good 30.7% |
| Serbians | 78.8 /100 | #149 | Good 30.7% |
| Somalis | 77.8 /100 | #150 | Good 30.7% |
| Italians | 77.0 /100 | #151 | Good 30.8% |
| Poles | 76.2 /100 | #152 | Good 30.8% |
| British | 76.0 /100 | #153 | Good 30.8% |
| Yugoslavians | 75.1 /100 | #154 | Good 30.8% |
| Immigrants | Bangladesh | 73.9 /100 | #155 | Good 30.9% |
| Carpatho Rusyns | 73.5 /100 | #156 | Good 30.9% |
| Immigrants | Eastern Africa | 72.1 /100 | #157 | Good 31.0% |
| Austrians | 69.9 /100 | #158 | Good 31.0% |
| Immigrants | England | 69.4 /100 | #159 | Good 31.1% |
| Immigrants | Western Europe | 69.3 /100 | #160 | Good 31.1% |
| Immigrants | Southern Europe | 68.7 /100 | #161 | Good 31.1% |