Scotch-Irish vs Filipino Births to Unmarried Women
COMPARE
Scotch-Irish
Filipino
Births to Unmarried Women
Births to Unmarried Women Comparison
Scotch-Irish
Filipinos
33.3%
BIRTHS TO UNMARRIED WOMEN
10.7/ 100
METRIC RATING
210th/ 347
METRIC RANK
23.0%
BIRTHS TO UNMARRIED WOMEN
100.0/ 100
METRIC RATING
3rd/ 347
METRIC RANK
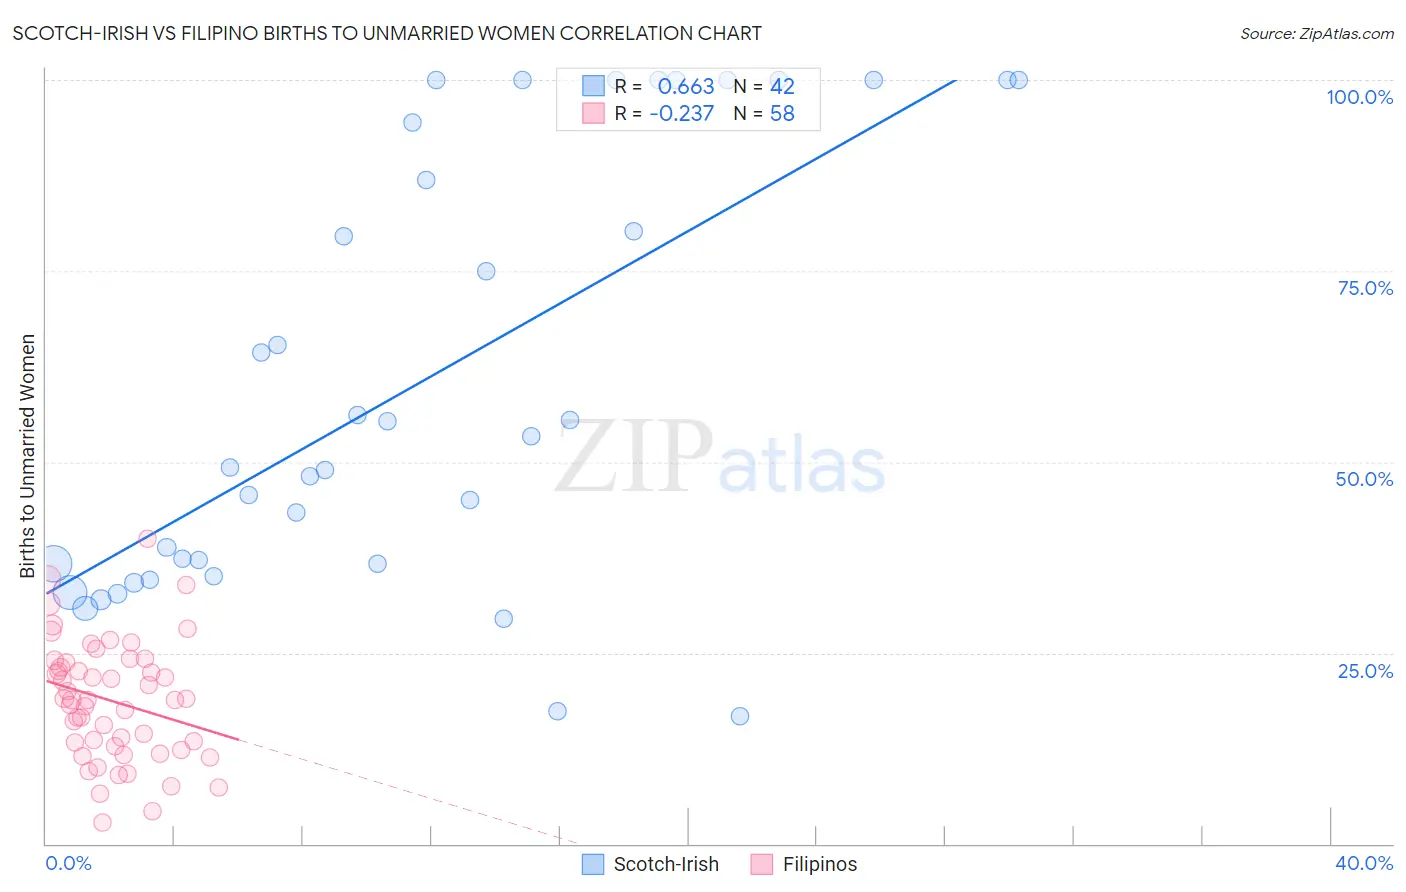
Scotch-Irish vs Filipino Births to Unmarried Women Correlation Chart
The statistical analysis conducted on geographies consisting of 488,755,262 people shows a significant positive correlation between the proportion of Scotch-Irish and percentage of births to unmarried women in the United States with a correlation coefficient (R) of 0.663 and weighted average of 33.3%. Similarly, the statistical analysis conducted on geographies consisting of 239,363,717 people shows a weak negative correlation between the proportion of Filipinos and percentage of births to unmarried women in the United States with a correlation coefficient (R) of -0.237 and weighted average of 23.0%, a difference of 44.7%.
Births to Unmarried Women Correlation Summary
| Measurement | Scotch-Irish | Filipino |
| Minimum | 16.7% | 2.8% |
| Maximum | 100.0% | 40.0% |
| Range | 83.3% | 37.2% |
| Mean | 60.2% | 18.7% |
| Median | 51.3% | 18.9% |
| Interquartile 25% (IQ1) | 36.6% | 12.7% |
| Interquartile 75% (IQ3) | 94.4% | 23.7% |
| Interquartile Range (IQR) | 57.8% | 11.0% |
| Standard Deviation (Sample) | 28.1% | 7.8% |
| Standard Deviation (Population) | 27.8% | 7.7% |
Similar Demographics by Births to Unmarried Women
Demographics Similar to Scotch-Irish by Births to Unmarried Women
In terms of births to unmarried women, the demographic groups most similar to Scotch-Irish are White/Caucasian (33.3%, a difference of 0.0%), Ecuadorian (33.3%, a difference of 0.050%), Celtic (33.3%, a difference of 0.12%), Hawaiian (33.2%, a difference of 0.14%), and Immigrants from Sudan (33.2%, a difference of 0.17%).
| Demographics | Rating | Rank | Births to Unmarried Women |
| Ute | 14.4 /100 | #203 | Poor 33.0% |
| Immigrants | Africa | 14.3 /100 | #204 | Poor 33.0% |
| German Russians | 13.1 /100 | #205 | Poor 33.1% |
| Uruguayans | 12.8 /100 | #206 | Poor 33.1% |
| Immigrants | Sudan | 11.5 /100 | #207 | Poor 33.2% |
| Hawaiians | 11.3 /100 | #208 | Poor 33.2% |
| Whites/Caucasians | 10.7 /100 | #209 | Poor 33.3% |
| Scotch-Irish | 10.7 /100 | #210 | Poor 33.3% |
| Ecuadorians | 10.5 /100 | #211 | Poor 33.3% |
| Celtics | 10.2 /100 | #212 | Poor 33.3% |
| Immigrants | Costa Rica | 9.5 /100 | #213 | Tragic 33.4% |
| Slovaks | 9.3 /100 | #214 | Tragic 33.4% |
| French | 8.7 /100 | #215 | Tragic 33.4% |
| Nepalese | 7.8 /100 | #216 | Tragic 33.5% |
| Spaniards | 7.0 /100 | #217 | Tragic 33.6% |
Demographics Similar to Filipinos by Births to Unmarried Women
In terms of births to unmarried women, the demographic groups most similar to Filipinos are Immigrants from Taiwan (23.0%, a difference of 0.14%), Immigrants from India (22.9%, a difference of 0.38%), Immigrants from Hong Kong (23.6%, a difference of 2.6%), Immigrants from Iran (24.0%, a difference of 4.3%), and Thai (24.0%, a difference of 4.6%).
| Demographics | Rating | Rank | Births to Unmarried Women |
| Assyrians/Chaldeans/Syriacs | 100.0 /100 | #1 | Exceptional 22.0% |
| Immigrants | India | 100.0 /100 | #2 | Exceptional 22.9% |
| Filipinos | 100.0 /100 | #3 | Exceptional 23.0% |
| Immigrants | Taiwan | 100.0 /100 | #4 | Exceptional 23.0% |
| Immigrants | Hong Kong | 100.0 /100 | #5 | Exceptional 23.6% |
| Immigrants | Iran | 100.0 /100 | #6 | Exceptional 24.0% |
| Thais | 100.0 /100 | #7 | Exceptional 24.0% |
| Immigrants | China | 100.0 /100 | #8 | Exceptional 24.7% |
| Immigrants | South Central Asia | 100.0 /100 | #9 | Exceptional 24.7% |
| Immigrants | Eastern Asia | 100.0 /100 | #10 | Exceptional 25.0% |
| Immigrants | Israel | 100.0 /100 | #11 | Exceptional 25.1% |
| Indians (Asian) | 100.0 /100 | #12 | Exceptional 25.3% |
| Iranians | 100.0 /100 | #13 | Exceptional 25.3% |
| Immigrants | Lebanon | 100.0 /100 | #14 | Exceptional 25.3% |
| Immigrants | Singapore | 100.0 /100 | #15 | Exceptional 25.6% |