Immigrants from Northern Africa vs Comanche Births to Unmarried Women
COMPARE
Immigrants from Northern Africa
Comanche
Births to Unmarried Women
Births to Unmarried Women Comparison
Immigrants from Northern Africa
Comanche
29.5%
BIRTHS TO UNMARRIED WOMEN
94.7/ 100
METRIC RATING
101st/ 347
METRIC RANK
36.7%
BIRTHS TO UNMARRIED WOMEN
0.1/ 100
METRIC RATING
268th/ 347
METRIC RANK
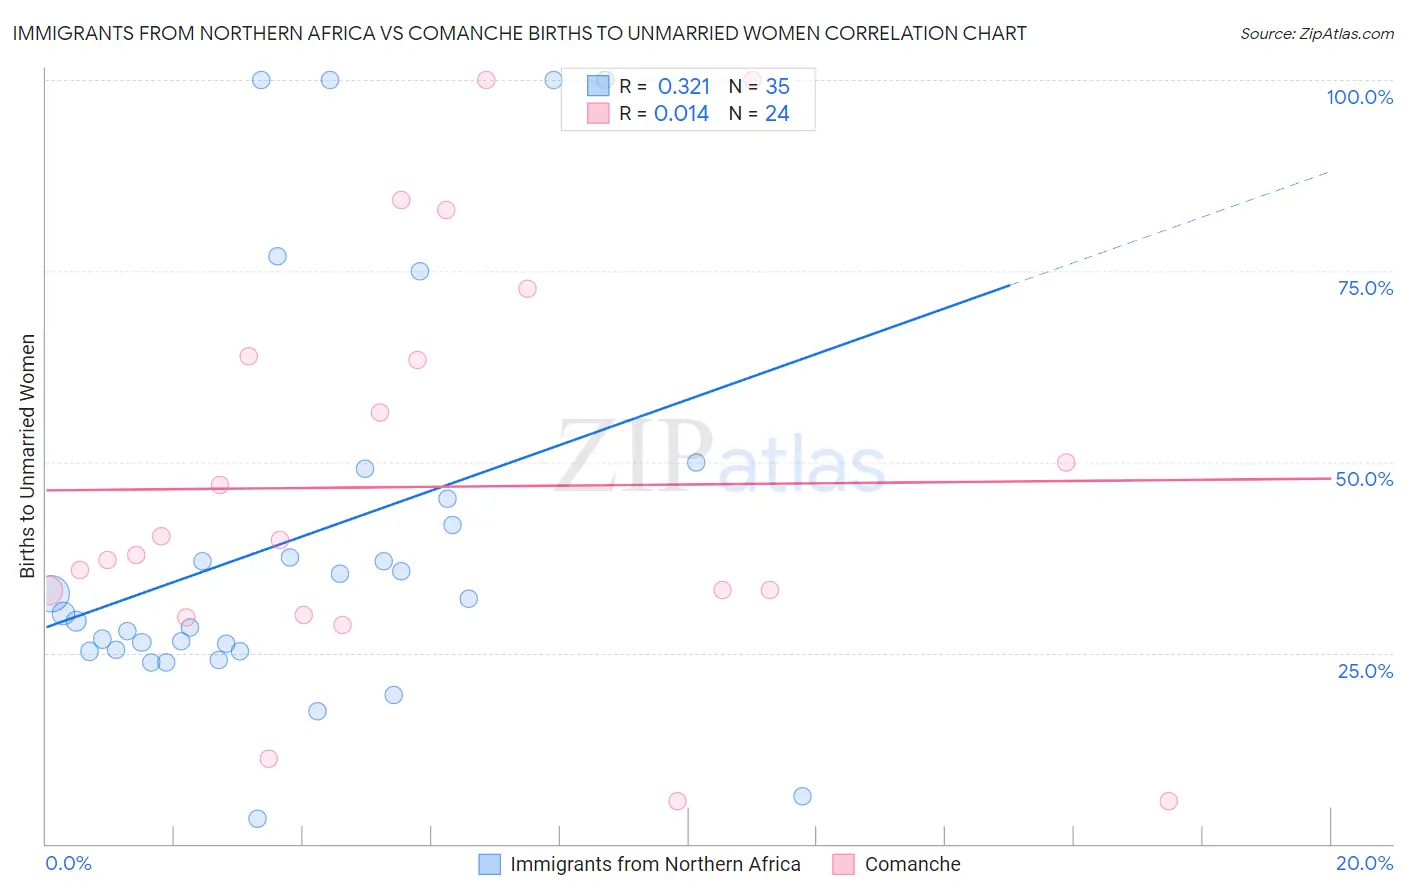
Immigrants from Northern Africa vs Comanche Births to Unmarried Women Correlation Chart
The statistical analysis conducted on geographies consisting of 302,719,907 people shows a mild positive correlation between the proportion of Immigrants from Northern Africa and percentage of births to unmarried women in the United States with a correlation coefficient (R) of 0.321 and weighted average of 29.5%. Similarly, the statistical analysis conducted on geographies consisting of 107,692,216 people shows no correlation between the proportion of Comanche and percentage of births to unmarried women in the United States with a correlation coefficient (R) of 0.014 and weighted average of 36.7%, a difference of 24.4%.
Births to Unmarried Women Correlation Summary
| Measurement | Immigrants from Northern Africa | Comanche |
| Minimum | 3.2% | 5.6% |
| Maximum | 100.0% | 100.0% |
| Range | 96.8% | 94.4% |
| Mean | 40.0% | 46.7% |
| Median | 30.2% | 38.8% |
| Interquartile 25% (IQ1) | 25.3% | 31.6% |
| Interquartile 75% (IQ3) | 45.1% | 63.6% |
| Interquartile Range (IQR) | 19.8% | 32.0% |
| Standard Deviation (Sample) | 26.3% | 26.6% |
| Standard Deviation (Population) | 25.9% | 26.0% |
Similar Demographics by Births to Unmarried Women
Demographics Similar to Immigrants from Northern Africa by Births to Unmarried Women
In terms of births to unmarried women, the demographic groups most similar to Immigrants from Northern Africa are Australian (29.5%, a difference of 0.080%), Lebanese (29.5%, a difference of 0.13%), Lithuanian (29.6%, a difference of 0.14%), Immigrants from Nepal (29.6%, a difference of 0.19%), and Immigrants from Denmark (29.4%, a difference of 0.29%).
| Demographics | Rating | Rank | Births to Unmarried Women |
| Ukrainians | 96.3 /100 | #94 | Exceptional 29.2% |
| Immigrants | Vietnam | 96.1 /100 | #95 | Exceptional 29.3% |
| Norwegians | 95.8 /100 | #96 | Exceptional 29.3% |
| Immigrants | South Africa | 95.7 /100 | #97 | Exceptional 29.3% |
| Immigrants | Syria | 95.7 /100 | #98 | Exceptional 29.4% |
| Immigrants | Denmark | 95.3 /100 | #99 | Exceptional 29.4% |
| Luxembourgers | 95.2 /100 | #100 | Exceptional 29.4% |
| Immigrants | Northern Africa | 94.7 /100 | #101 | Exceptional 29.5% |
| Australians | 94.6 /100 | #102 | Exceptional 29.5% |
| Lebanese | 94.4 /100 | #103 | Exceptional 29.5% |
| Lithuanians | 94.4 /100 | #104 | Exceptional 29.6% |
| Immigrants | Nepal | 94.3 /100 | #105 | Exceptional 29.6% |
| Swedes | 93.8 /100 | #106 | Exceptional 29.6% |
| Immigrants | Brazil | 93.7 /100 | #107 | Exceptional 29.6% |
| Paraguayans | 93.5 /100 | #108 | Exceptional 29.7% |
Demographics Similar to Comanche by Births to Unmarried Women
In terms of births to unmarried women, the demographic groups most similar to Comanche are Central American (36.7%, a difference of 0.010%), Immigrants from Senegal (36.7%, a difference of 0.080%), Senegalese (36.8%, a difference of 0.12%), Cherokee (36.7%, a difference of 0.13%), and Subsaharan African (36.7%, a difference of 0.18%).
| Demographics | Rating | Rank | Births to Unmarried Women |
| Trinidadians and Tobagonians | 0.2 /100 | #261 | Tragic 36.5% |
| French American Indians | 0.1 /100 | #262 | Tragic 36.6% |
| Nicaraguans | 0.1 /100 | #263 | Tragic 36.6% |
| Sub-Saharan Africans | 0.1 /100 | #264 | Tragic 36.7% |
| Cherokee | 0.1 /100 | #265 | Tragic 36.7% |
| Immigrants | Senegal | 0.1 /100 | #266 | Tragic 36.7% |
| Central Americans | 0.1 /100 | #267 | Tragic 36.7% |
| Comanche | 0.1 /100 | #268 | Tragic 36.7% |
| Senegalese | 0.1 /100 | #269 | Tragic 36.8% |
| Immigrants | Congo | 0.1 /100 | #270 | Tragic 36.8% |
| Immigrants | Barbados | 0.1 /100 | #271 | Tragic 36.8% |
| Choctaw | 0.1 /100 | #272 | Tragic 36.9% |
| Mexicans | 0.1 /100 | #273 | Tragic 36.9% |
| Cree | 0.1 /100 | #274 | Tragic 37.0% |
| Barbadians | 0.1 /100 | #275 | Tragic 37.0% |