Iranian vs Comanche Births to Unmarried Women
COMPARE
Iranian
Comanche
Births to Unmarried Women
Births to Unmarried Women Comparison
Iranians
Comanche
25.3%
BIRTHS TO UNMARRIED WOMEN
100.0/ 100
METRIC RATING
13th/ 347
METRIC RANK
36.7%
BIRTHS TO UNMARRIED WOMEN
0.1/ 100
METRIC RATING
268th/ 347
METRIC RANK
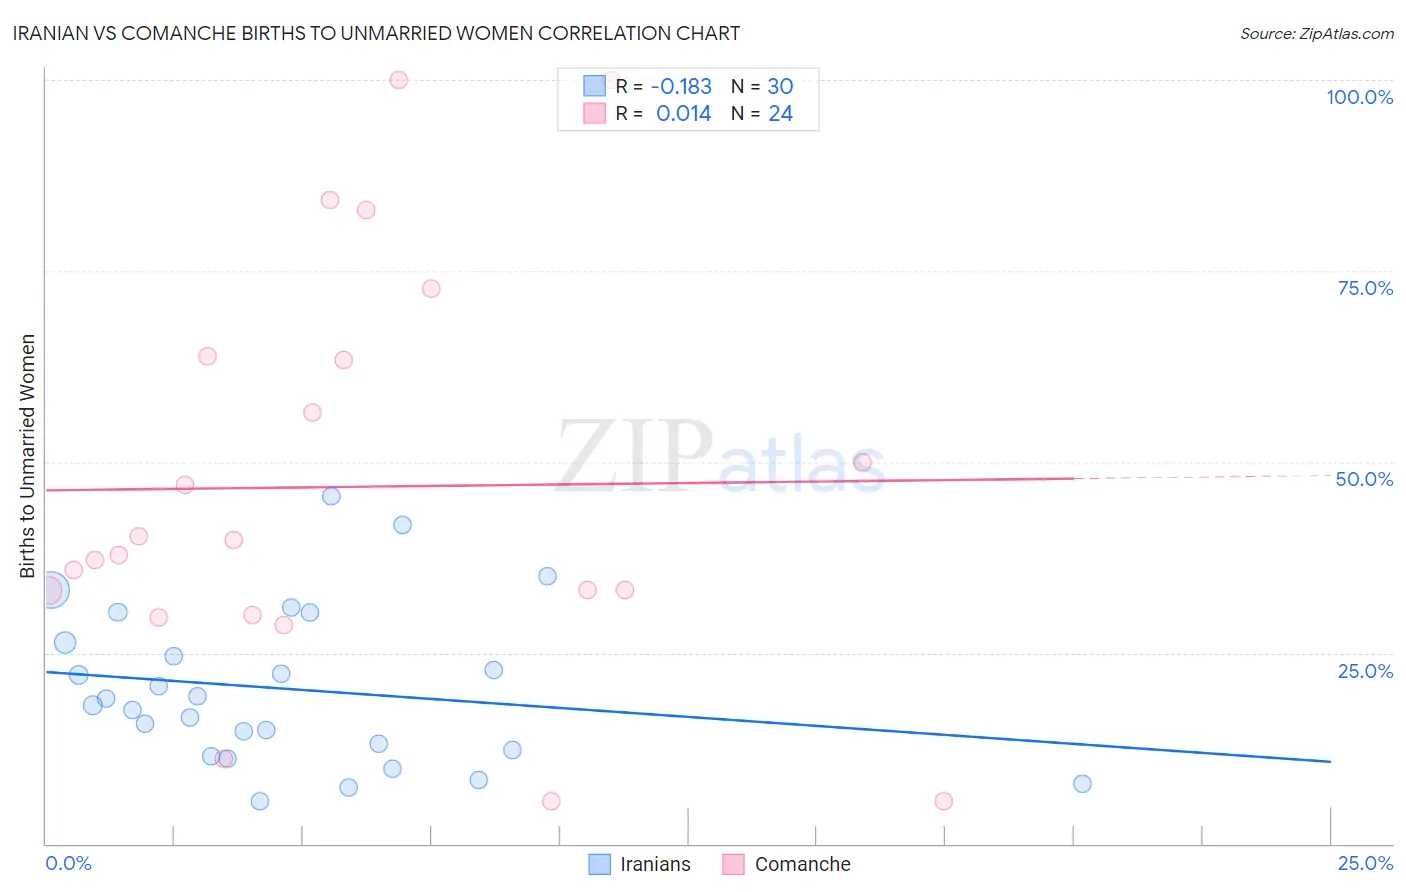
Iranian vs Comanche Births to Unmarried Women Correlation Chart
The statistical analysis conducted on geographies consisting of 297,991,005 people shows a poor negative correlation between the proportion of Iranians and percentage of births to unmarried women in the United States with a correlation coefficient (R) of -0.183 and weighted average of 25.3%. Similarly, the statistical analysis conducted on geographies consisting of 107,692,216 people shows no correlation between the proportion of Comanche and percentage of births to unmarried women in the United States with a correlation coefficient (R) of 0.014 and weighted average of 36.7%, a difference of 45.1%.
Births to Unmarried Women Correlation Summary
| Measurement | Iranian | Comanche |
| Minimum | 5.5% | 5.6% |
| Maximum | 45.5% | 100.0% |
| Range | 40.0% | 94.4% |
| Mean | 20.3% | 46.7% |
| Median | 18.6% | 38.8% |
| Interquartile 25% (IQ1) | 12.2% | 31.6% |
| Interquartile 75% (IQ3) | 26.4% | 63.6% |
| Interquartile Range (IQR) | 14.2% | 32.0% |
| Standard Deviation (Sample) | 10.2% | 26.6% |
| Standard Deviation (Population) | 10.1% | 26.0% |
Similar Demographics by Births to Unmarried Women
Demographics Similar to Iranians by Births to Unmarried Women
In terms of births to unmarried women, the demographic groups most similar to Iranians are Immigrants from Lebanon (25.3%, a difference of 0.12%), Indian (Asian) (25.3%, a difference of 0.14%), Immigrants from Israel (25.1%, a difference of 0.61%), Immigrants from Eastern Asia (25.0%, a difference of 1.0%), and Immigrants from Singapore (25.6%, a difference of 1.3%).
| Demographics | Rating | Rank | Births to Unmarried Women |
| Immigrants | Iran | 100.0 /100 | #6 | Exceptional 24.0% |
| Thais | 100.0 /100 | #7 | Exceptional 24.0% |
| Immigrants | China | 100.0 /100 | #8 | Exceptional 24.7% |
| Immigrants | South Central Asia | 100.0 /100 | #9 | Exceptional 24.7% |
| Immigrants | Eastern Asia | 100.0 /100 | #10 | Exceptional 25.0% |
| Immigrants | Israel | 100.0 /100 | #11 | Exceptional 25.1% |
| Indians (Asian) | 100.0 /100 | #12 | Exceptional 25.3% |
| Iranians | 100.0 /100 | #13 | Exceptional 25.3% |
| Immigrants | Lebanon | 100.0 /100 | #14 | Exceptional 25.3% |
| Immigrants | Singapore | 100.0 /100 | #15 | Exceptional 25.6% |
| Immigrants | Belarus | 100.0 /100 | #16 | Exceptional 25.6% |
| Immigrants | Uzbekistan | 100.0 /100 | #17 | Exceptional 25.8% |
| Immigrants | Armenia | 99.9 /100 | #18 | Exceptional 26.1% |
| Armenians | 99.9 /100 | #19 | Exceptional 26.2% |
| Immigrants | Korea | 99.9 /100 | #20 | Exceptional 26.3% |
Demographics Similar to Comanche by Births to Unmarried Women
In terms of births to unmarried women, the demographic groups most similar to Comanche are Central American (36.7%, a difference of 0.010%), Immigrants from Senegal (36.7%, a difference of 0.080%), Senegalese (36.8%, a difference of 0.12%), Cherokee (36.7%, a difference of 0.13%), and Subsaharan African (36.7%, a difference of 0.18%).
| Demographics | Rating | Rank | Births to Unmarried Women |
| Trinidadians and Tobagonians | 0.2 /100 | #261 | Tragic 36.5% |
| French American Indians | 0.1 /100 | #262 | Tragic 36.6% |
| Nicaraguans | 0.1 /100 | #263 | Tragic 36.6% |
| Sub-Saharan Africans | 0.1 /100 | #264 | Tragic 36.7% |
| Cherokee | 0.1 /100 | #265 | Tragic 36.7% |
| Immigrants | Senegal | 0.1 /100 | #266 | Tragic 36.7% |
| Central Americans | 0.1 /100 | #267 | Tragic 36.7% |
| Comanche | 0.1 /100 | #268 | Tragic 36.7% |
| Senegalese | 0.1 /100 | #269 | Tragic 36.8% |
| Immigrants | Congo | 0.1 /100 | #270 | Tragic 36.8% |
| Immigrants | Barbados | 0.1 /100 | #271 | Tragic 36.8% |
| Choctaw | 0.1 /100 | #272 | Tragic 36.9% |
| Mexicans | 0.1 /100 | #273 | Tragic 36.9% |
| Cree | 0.1 /100 | #274 | Tragic 37.0% |
| Barbadians | 0.1 /100 | #275 | Tragic 37.0% |