Scotch-Irish vs Comanche Family Households with Children
COMPARE
Scotch-Irish
Comanche
Family Households with Children
Family Households with Children Comparison
Scotch-Irish
Comanche
26.8%
FAMILY HOUSEHOLDS WITH CHILDREN
1.4/ 100
METRIC RATING
256th/ 347
METRIC RANK
27.6%
FAMILY HOUSEHOLDS WITH CHILDREN
74.8/ 100
METRIC RATING
155th/ 347
METRIC RANK
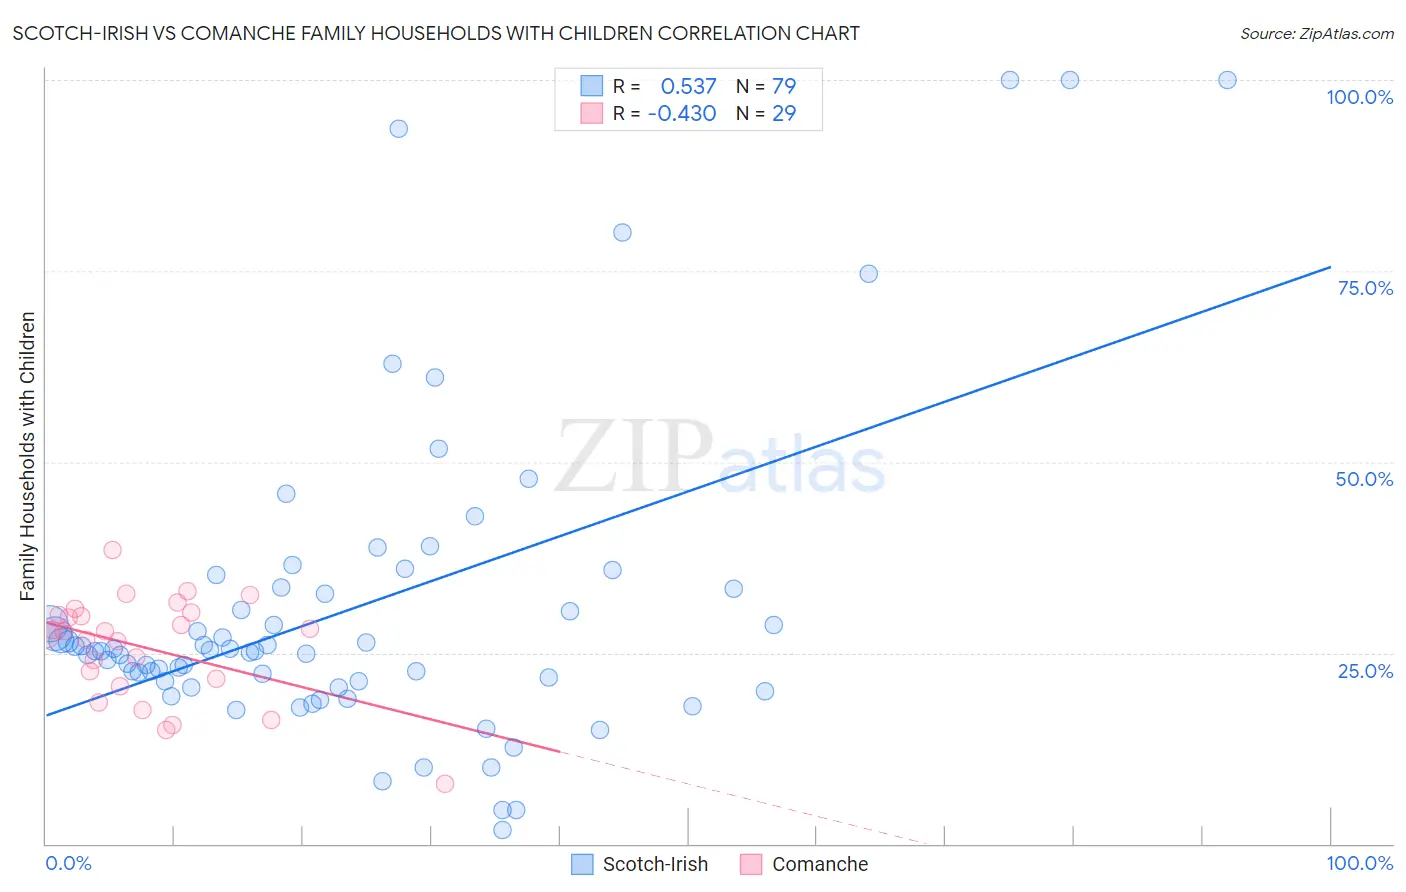
Scotch-Irish vs Comanche Family Households with Children Correlation Chart
The statistical analysis conducted on geographies consisting of 548,065,437 people shows a substantial positive correlation between the proportion of Scotch-Irish and percentage of family households with children in the United States with a correlation coefficient (R) of 0.537 and weighted average of 26.8%. Similarly, the statistical analysis conducted on geographies consisting of 109,763,732 people shows a moderate negative correlation between the proportion of Comanche and percentage of family households with children in the United States with a correlation coefficient (R) of -0.430 and weighted average of 27.6%, a difference of 3.0%.
Family Households with Children Correlation Summary
| Measurement | Scotch-Irish | Comanche |
| Minimum | 1.9% | 7.8% |
| Maximum | 100.0% | 38.4% |
| Range | 98.1% | 30.5% |
| Mean | 30.8% | 25.6% |
| Median | 25.3% | 27.8% |
| Interquartile 25% (IQ1) | 21.2% | 21.1% |
| Interquartile 75% (IQ3) | 33.3% | 30.1% |
| Interquartile Range (IQR) | 12.1% | 9.0% |
| Standard Deviation (Sample) | 20.6% | 6.8% |
| Standard Deviation (Population) | 20.5% | 6.6% |
Similar Demographics by Family Households with Children
Demographics Similar to Scotch-Irish by Family Households with Children
In terms of family households with children, the demographic groups most similar to Scotch-Irish are German Russian (26.8%, a difference of 0.010%), Immigrants from Scotland (26.8%, a difference of 0.020%), Italian (26.8%, a difference of 0.050%), Slavic (26.8%, a difference of 0.050%), and Immigrants from Cuba (26.8%, a difference of 0.050%).
| Demographics | Rating | Rank | Family Households with Children |
| Immigrants | Eastern Europe | 2.1 /100 | #249 | Tragic 26.9% |
| Belgians | 2.1 /100 | #250 | Tragic 26.9% |
| Immigrants | Bosnia and Herzegovina | 1.9 /100 | #251 | Tragic 26.8% |
| Irish | 1.8 /100 | #252 | Tragic 26.8% |
| Italians | 1.5 /100 | #253 | Tragic 26.8% |
| Immigrants | Scotland | 1.5 /100 | #254 | Tragic 26.8% |
| German Russians | 1.5 /100 | #255 | Tragic 26.8% |
| Scotch-Irish | 1.4 /100 | #256 | Tragic 26.8% |
| Slavs | 1.3 /100 | #257 | Tragic 26.8% |
| Immigrants | Cuba | 1.3 /100 | #258 | Tragic 26.8% |
| Immigrants | Lithuania | 1.2 /100 | #259 | Tragic 26.8% |
| Immigrants | Jamaica | 1.2 /100 | #260 | Tragic 26.8% |
| Immigrants | Belarus | 1.1 /100 | #261 | Tragic 26.8% |
| Immigrants | Russia | 1.0 /100 | #262 | Tragic 26.8% |
| Immigrants | North Macedonia | 1.0 /100 | #263 | Tragic 26.7% |
Demographics Similar to Comanche by Family Households with Children
In terms of family households with children, the demographic groups most similar to Comanche are Icelander (27.6%, a difference of 0.010%), Hungarian (27.6%, a difference of 0.010%), Immigrants from Cabo Verde (27.6%, a difference of 0.020%), Ethiopian (27.6%, a difference of 0.060%), and Portuguese (27.6%, a difference of 0.090%).
| Demographics | Rating | Rank | Family Households with Children |
| Osage | 79.0 /100 | #148 | Good 27.6% |
| Menominee | 78.9 /100 | #149 | Good 27.6% |
| Argentineans | 78.5 /100 | #150 | Good 27.6% |
| Portuguese | 77.8 /100 | #151 | Good 27.6% |
| Ethiopians | 77.0 /100 | #152 | Good 27.6% |
| Immigrants | Cabo Verde | 75.6 /100 | #153 | Good 27.6% |
| Icelanders | 75.3 /100 | #154 | Good 27.6% |
| Comanche | 74.8 /100 | #155 | Good 27.6% |
| Hungarians | 74.6 /100 | #156 | Good 27.6% |
| Indians (Asian) | 71.6 /100 | #157 | Good 27.6% |
| Romanians | 70.8 /100 | #158 | Good 27.6% |
| Mongolians | 70.7 /100 | #159 | Good 27.6% |
| Sub-Saharan Africans | 67.5 /100 | #160 | Good 27.6% |
| Alaskan Athabascans | 67.1 /100 | #161 | Good 27.6% |
| Immigrants | Bangladesh | 67.0 /100 | #162 | Good 27.6% |