Scotch-Irish vs Czech Births to Unmarried Women

COMPARE

Scotch-Irish
Race
Ancestry
AfghanAfricanAlaska NativeAlaskan AthabascanAlbanianAleutAlsatianAmericanApacheArabArapahoArgentineanArmenianAssyrian/Chaldean/SyriacAustralianAustrianBahamianBangladeshiBarbadianBasqueBelgianBelizeanBermudanBhutaneseBlackfeetBolivianBrazilianBritishBritish West IndianBulgarianBurmeseCajunCambodianCanadianCape VerdeanCarpatho RusynCelticCentral AmericanCentral American IndianCherokeeCheyenneChickasawChileanChineseChippewaChoctawColombianColvilleComancheCosta RicanCreeCreekCroatianCrowCubanCypriotCzechoslovakianDanishDelawareDominicanDutchDutch West IndianEastern EuropeanEcuadorianEgyptianEnglishEstonianEthiopianEuropeanFijianFilipinoFinnishFrenchFrench American IndianFrench CanadianGermanGerman RussianGhanaianGreekGuamanian/ChamorroGuatemalanGuyaneseHaitianHmongHonduranHopiHoumaHungarianIcelanderIndian (Asian)IndonesianInupiatIranianIraqiIrishIroquoisIsraeliItalianJamaicanJapaneseJordanianKenyanKiowaKoreanLaotianLatvianLebaneseLiberianLithuanianLumbeeLuxembourgerMacedonianMalaysianMalteseMarshalleseMenomineeMexicanMexican American IndianMongolianMoroccanNative HawaiianNavajoNepaleseNew ZealanderNicaraguanNigerianNorthern EuropeanNorwegianOkinawanOsageOttawaPaiutePakistaniPalestinianPanamanianParaguayanPennsylvania GermanPeruvianPimaPolishPortuguesePotawatomiPuebloPuerto RicanPuget Sound SalishRomanianRussianSalvadoranSamoanScandinavianScotch-IrishScottishSeminoleSenegaleseSerbianShoshoneSierra LeoneanSiouxSlavicSlovakSloveneSomaliSouth AfricanSouth AmericanSouth American IndianSoviet UnionSpaniardSpanishSpanish AmericanSpanish American IndianSri LankanSubsaharan AfricanSudaneseSwedishSwissSyrianTaiwaneseThaiTlingit-HaidaTohono O'OdhamTonganTrinidadian and TobagonianTsimshianTurkishU.S. Virgin IslanderUgandanUkrainianUruguayanUteVenezuelanVietnameseWelshWest IndianYakamaYaquiYugoslavianYumanYup'ikZimbabwean
Immigration
NonimmigrantsImmigrantsAfghanistanAfricaAlbaniaArgentinaArmeniaAsiaAustraliaAustriaBahamasBangladeshBarbadosBelarusBelgiumBelizeBoliviaBosnia and HerzegovinaBrazilBulgariaBurma/MyanmarCabo VerdeCambodiaCameroonCanadaCaribbeanCentral AmericaChileChinaColombiaCongoCosta RicaCroatiaCubaCzechoslovakiaDenmarkDominicaDominican RepublicEastern AfricaEastern AsiaEastern EuropeEcuadorEgyptEl SalvadorEnglandEritreaEthiopiaEuropeFijiFranceGermanyGhanaGreeceGrenadaGuatemalaGuyanaHaitiHondurasHong KongHungaryIndiaIndonesiaIranIraqIrelandIsraelItalyJamaicaJapanJordanKazakhstanKenyaKoreaKuwaitLaosLatin AmericaLatviaLebanonLiberiaLithuaniaMalaysiaMexicoMicronesiaMiddle AfricaMoldovaMoroccoNepalNetherlandsNicaraguaNigeriaNorth AmericaNorth MacedoniaNorthern AfricaNorthern EuropeNorwayOceaniaPakistanPanamaPeruPhilippinesPolandPortugalRomaniaRussiaSaudi ArabiaScotlandSenegalSerbiaSierra LeoneSingaporeSomaliaSouth AfricaSouth AmericaSouth Central AsiaSouth Eastern AsiaSouthern EuropeSpainSri LankaSt. Vincent and the GrenadinesSudanSwedenSwitzerlandSyriaTaiwanThailandTrinidad and TobagoTurkeyUgandaUkraineUruguayUzbekistanVenezuelaVietnamWest IndiesWestern AfricaWestern AsiaWestern EuropeYemenZaireZimbabweAzores
Czech
Race
Ancestry
AfghanAfricanAlaska NativeAlaskan AthabascanAlbanianAleutAlsatianAmericanApacheArabArapahoArgentineanArmenianAssyrian/Chaldean/SyriacAustralianAustrianBahamianBangladeshiBarbadianBasqueBelgianBelizeanBermudanBhutaneseBlackfeetBolivianBrazilianBritishBritish West IndianBulgarianBurmeseCajunCambodianCanadianCape VerdeanCarpatho RusynCelticCentral AmericanCentral American IndianCherokeeCheyenneChickasawChileanChineseChippewaChoctawColombianColvilleComancheCosta RicanCreeCreekCroatianCrowCubanCypriotCzechCzechoslovakianDanishDelawareDominicanDutchDutch West IndianEastern EuropeanEcuadorianEgyptianEnglishEstonianEthiopianEuropeanFijianFilipinoFinnishFrenchFrench American IndianFrench CanadianGermanGerman RussianGhanaianGreekGuamanian/ChamorroGuatemalanGuyaneseHaitianHmongHonduranHopiHoumaHungarianIcelanderIndian (Asian)IndonesianInupiatIranianIraqiIrishIroquoisIsraeliItalianJamaicanJapaneseJordanianKenyanKiowaKoreanLaotianLatvianLebaneseLiberianLithuanianLumbeeLuxembourgerMacedonianMalaysianMalteseMarshalleseMenomineeMexicanMexican American IndianMongolianMoroccanNative HawaiianNavajoNepaleseNew ZealanderNicaraguanNigerianNorthern EuropeanNorwegianOkinawanOsageOttawaPaiutePakistaniPalestinianPanamanianParaguayanPennsylvania GermanPeruvianPimaPolishPortuguesePotawatomiPuebloPuerto RicanPuget Sound SalishRomanianRussianSalvadoranSamoanScandinavianScottishSeminoleSenegaleseSerbianShoshoneSierra LeoneanSiouxSlavicSlovakSloveneSomaliSouth AfricanSouth AmericanSouth American IndianSoviet UnionSpaniardSpanishSpanish AmericanSpanish American IndianSri LankanSubsaharan AfricanSudaneseSwedishSwissSyrianTaiwaneseThaiTlingit-HaidaTohono O'OdhamTonganTrinidadian and TobagonianTsimshianTurkishU.S. Virgin IslanderUgandanUkrainianUruguayanUteVenezuelanVietnameseWelshWest IndianYakamaYaquiYugoslavianYumanYup'ikZimbabwean
Immigration
NonimmigrantsImmigrantsAfghanistanAfricaAlbaniaArgentinaArmeniaAsiaAustraliaAustriaBahamasBangladeshBarbadosBelarusBelgiumBelizeBoliviaBosnia and HerzegovinaBrazilBulgariaBurma/MyanmarCabo VerdeCambodiaCameroonCanadaCaribbeanCentral AmericaChileChinaColombiaCongoCosta RicaCroatiaCubaCzechoslovakiaDenmarkDominicaDominican RepublicEastern AfricaEastern AsiaEastern EuropeEcuadorEgyptEl SalvadorEnglandEritreaEthiopiaEuropeFijiFranceGermanyGhanaGreeceGrenadaGuatemalaGuyanaHaitiHondurasHong KongHungaryIndiaIndonesiaIranIraqIrelandIsraelItalyJamaicaJapanJordanKazakhstanKenyaKoreaKuwaitLaosLatin AmericaLatviaLebanonLiberiaLithuaniaMalaysiaMexicoMicronesiaMiddle AfricaMoldovaMoroccoNepalNetherlandsNicaraguaNigeriaNorth AmericaNorth MacedoniaNorthern AfricaNorthern EuropeNorwayOceaniaPakistanPanamaPeruPhilippinesPolandPortugalRomaniaRussiaSaudi ArabiaScotlandSenegalSerbiaSierra LeoneSingaporeSomaliaSouth AfricaSouth AmericaSouth Central AsiaSouth Eastern AsiaSouthern EuropeSpainSri LankaSt. Vincent and the GrenadinesSudanSwedenSwitzerlandSyriaTaiwanThailandTrinidad and TobagoTurkeyUgandaUkraineUruguayUzbekistanVenezuelaVietnamWest IndiesWestern AfricaWestern AsiaWestern EuropeYemenZaireZimbabweAzores
Births to Unmarried Women
Income
Poverty
Unemployment
Labor Participation
Family Structure
Vehicle Availability
Education Level
Disability

Births to Unmarried Women Comparison

Scotch-Irish

Czechs

Poor
Excellent
33.3%
BIRTHS TO UNMARRIED WOMEN
10.7/ 100
METRIC RATING
210th/ 347
METRIC RANK
30.5%
BIRTHS TO UNMARRIED WOMEN
82.1/ 100
METRIC RATING
144th/ 347
METRIC RANK

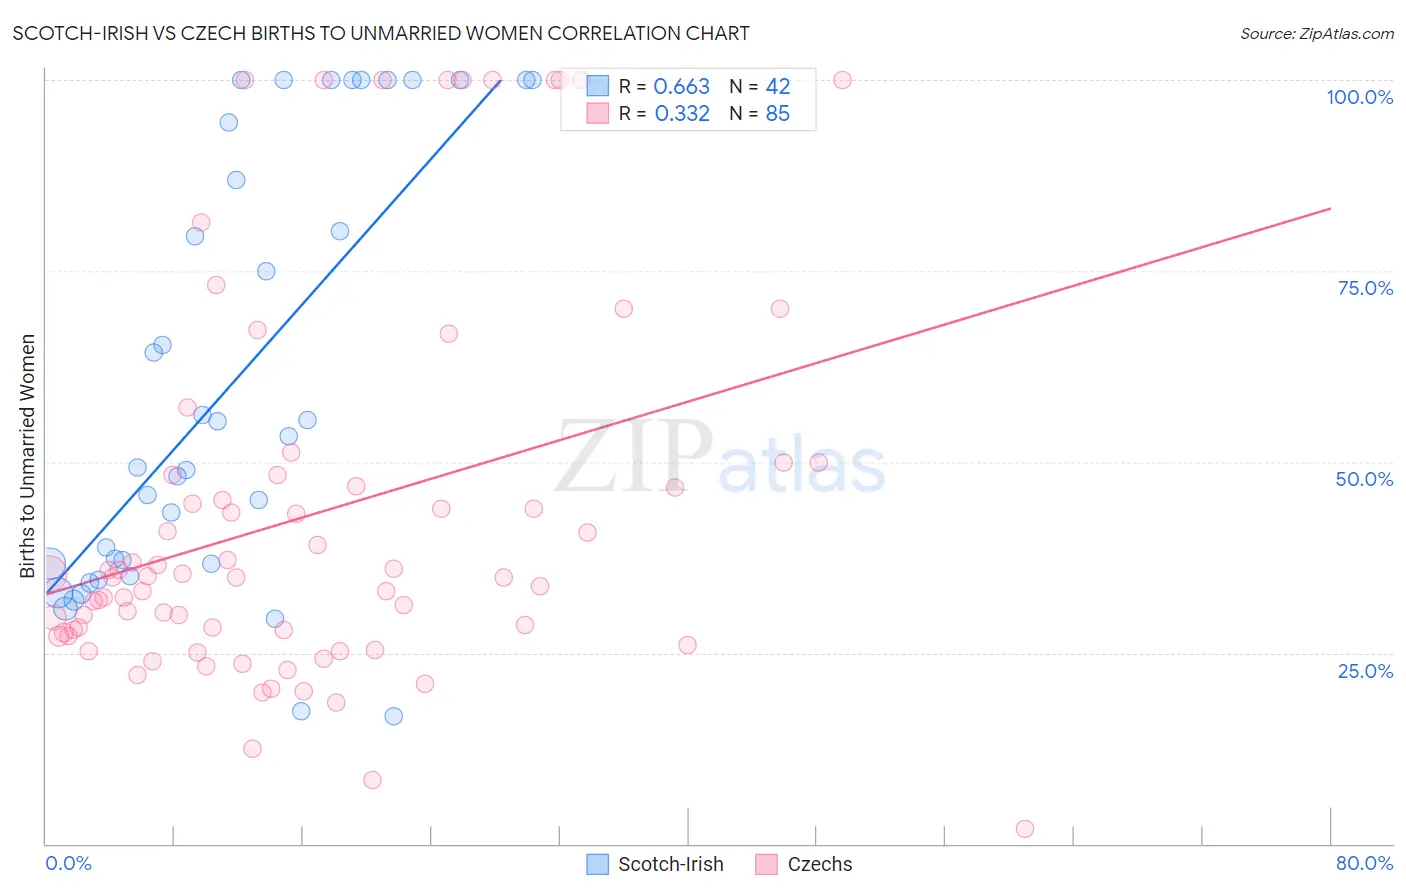
Scotch-Irish vs Czech Births to Unmarried Women Correlation Chart

The statistical analysis conducted on geographies consisting of 488,755,262 people shows a significant positive correlation between the proportion of Scotch-Irish and percentage of births to unmarried women in the United States with a correlation coefficient (R) of 0.663 and weighted average of 33.3%. Similarly, the statistical analysis conducted on geographies consisting of 439,200,510 people shows a mild positive correlation between the proportion of Czechs and percentage of births to unmarried women in the United States with a correlation coefficient (R) of 0.332 and weighted average of 30.5%, a difference of 8.9%.
Scotch-Irish vs Czech Births to Unmarried Women

Births to Unmarried Women Correlation Summary

MeasurementScotch-IrishCzech
Minimum16.7%1.9%
Maximum100.0%100.0%
Range83.3%98.1%
Mean60.2%43.1%
Median51.3%34.9%
Interquartile 25% (IQ1)36.6%27.4%
Interquartile 75% (IQ3)94.4%48.3%
Interquartile Range (IQR)57.8%20.8%
Standard Deviation (Sample)28.1%25.0%
Standard Deviation (Population)27.8%24.9%

Similar Demographics by Births to Unmarried Women

Demographics Similar to Scotch-Irish by Births to Unmarried Women

In terms of births to unmarried women, the demographic groups most similar to Scotch-Irish are White/Caucasian (33.3%, a difference of 0.0%), Ecuadorian (33.3%, a difference of 0.050%), Celtic (33.3%, a difference of 0.12%), Hawaiian (33.2%, a difference of 0.14%), and Immigrants from Sudan (33.2%, a difference of 0.17%).
DemographicsRating | RankBirths to Unmarried Women
Ute
14.4
/100
|
#203
Poor
33.0%
Immigrants | Africa
14.3
/100
|
#204
Poor
33.0%
German Russians
13.1
/100
|
#205
Poor
33.1%
Uruguayans
12.8
/100
|
#206
Poor
33.1%
Immigrants | Sudan
11.5
/100
|
#207
Poor
33.2%
Hawaiians
11.3
/100
|
#208
Poor
33.2%
Whites/Caucasians
10.7
/100
|
#209
Poor
33.3%
Scotch-Irish
10.7
/100
|
#210
Poor
33.3%
Ecuadorians
10.5
/100
|
#211
Poor
33.3%
Celtics
10.2
/100
|
#212
Poor
33.3%
Immigrants | Costa Rica
9.5
/100
|
#213
Tragic
33.4%
Slovaks
9.3
/100
|
#214
Tragic
33.4%
French
8.7
/100
|
#215
Tragic
33.4%
Nepalese
7.8
/100
|
#216
Tragic
33.5%
Spaniards
7.0
/100
|
#217
Tragic
33.6%

Demographics Similar to Czechs by Births to Unmarried Women

In terms of births to unmarried women, the demographic groups most similar to Czechs are Immigrants from Uganda (30.5%, a difference of 0.070%), South African (30.5%, a difference of 0.090%), Immigrants from North America (30.6%, a difference of 0.10%), Northern European (30.6%, a difference of 0.13%), and Pakistani (30.5%, a difference of 0.15%).
DemographicsRating | RankBirths to Unmarried Women
Immigrants | Philippines
83.9
/100
|
#137
Excellent
30.4%
Puget Sound Salish
83.9
/100
|
#138
Excellent
30.4%
Immigrants | Canada
83.7
/100
|
#139
Excellent
30.4%
Swiss
83.1
/100
|
#140
Excellent
30.5%
Pakistanis
83.0
/100
|
#141
Excellent
30.5%
South Africans
82.7
/100
|
#142
Excellent
30.5%
Immigrants | Uganda
82.6
/100
|
#143
Excellent
30.5%
Czechs
82.1
/100
|
#144
Excellent
30.5%
Immigrants | North America
81.5
/100
|
#145
Excellent
30.6%
Northern Europeans
81.4
/100
|
#146
Excellent
30.6%
Immigrants | Oceania
81.2
/100
|
#147
Excellent
30.6%
Chileans
79.1
/100
|
#148
Good
30.7%
Serbians
78.8
/100
|
#149
Good
30.7%
Somalis
77.8
/100
|
#150
Good
30.7%
Italians
77.0
/100
|
#151
Good
30.8%