Scotch-Irish vs Apache Births to Unmarried Women
COMPARE
Scotch-Irish
Apache
Births to Unmarried Women
Births to Unmarried Women Comparison
Scotch-Irish
Apache
33.3%
BIRTHS TO UNMARRIED WOMEN
10.7/ 100
METRIC RATING
210th/ 347
METRIC RANK
39.9%
BIRTHS TO UNMARRIED WOMEN
0.0/ 100
METRIC RATING
316th/ 347
METRIC RANK
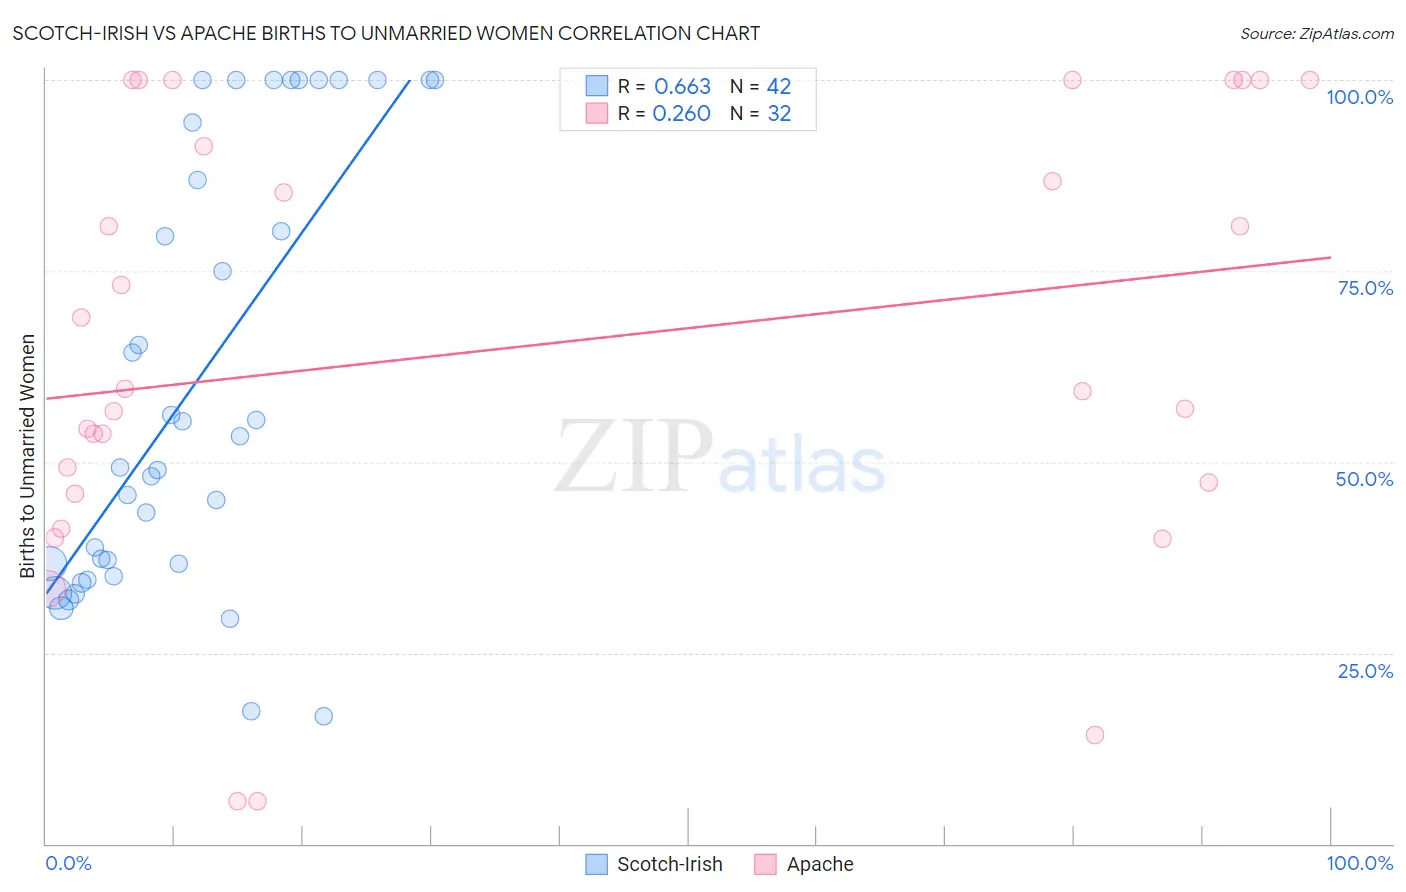
Scotch-Irish vs Apache Births to Unmarried Women Correlation Chart
The statistical analysis conducted on geographies consisting of 488,755,262 people shows a significant positive correlation between the proportion of Scotch-Irish and percentage of births to unmarried women in the United States with a correlation coefficient (R) of 0.663 and weighted average of 33.3%. Similarly, the statistical analysis conducted on geographies consisting of 223,899,769 people shows a weak positive correlation between the proportion of Apache and percentage of births to unmarried women in the United States with a correlation coefficient (R) of 0.260 and weighted average of 39.9%, a difference of 19.9%.
Births to Unmarried Women Correlation Summary
| Measurement | Scotch-Irish | Apache |
| Minimum | 16.7% | 5.6% |
| Maximum | 100.0% | 100.0% |
| Range | 83.3% | 94.4% |
| Mean | 60.2% | 65.1% |
| Median | 51.3% | 59.4% |
| Interquartile 25% (IQ1) | 36.6% | 46.6% |
| Interquartile 75% (IQ3) | 94.4% | 95.7% |
| Interquartile Range (IQR) | 57.8% | 49.1% |
| Standard Deviation (Sample) | 28.1% | 28.9% |
| Standard Deviation (Population) | 27.8% | 28.4% |
Similar Demographics by Births to Unmarried Women
Demographics Similar to Scotch-Irish by Births to Unmarried Women
In terms of births to unmarried women, the demographic groups most similar to Scotch-Irish are White/Caucasian (33.3%, a difference of 0.0%), Ecuadorian (33.3%, a difference of 0.050%), Celtic (33.3%, a difference of 0.12%), Hawaiian (33.2%, a difference of 0.14%), and Immigrants from Sudan (33.2%, a difference of 0.17%).
| Demographics | Rating | Rank | Births to Unmarried Women |
| Ute | 14.4 /100 | #203 | Poor 33.0% |
| Immigrants | Africa | 14.3 /100 | #204 | Poor 33.0% |
| German Russians | 13.1 /100 | #205 | Poor 33.1% |
| Uruguayans | 12.8 /100 | #206 | Poor 33.1% |
| Immigrants | Sudan | 11.5 /100 | #207 | Poor 33.2% |
| Hawaiians | 11.3 /100 | #208 | Poor 33.2% |
| Whites/Caucasians | 10.7 /100 | #209 | Poor 33.3% |
| Scotch-Irish | 10.7 /100 | #210 | Poor 33.3% |
| Ecuadorians | 10.5 /100 | #211 | Poor 33.3% |
| Celtics | 10.2 /100 | #212 | Poor 33.3% |
| Immigrants | Costa Rica | 9.5 /100 | #213 | Tragic 33.4% |
| Slovaks | 9.3 /100 | #214 | Tragic 33.4% |
| French | 8.7 /100 | #215 | Tragic 33.4% |
| Nepalese | 7.8 /100 | #216 | Tragic 33.5% |
| Spaniards | 7.0 /100 | #217 | Tragic 33.6% |
Demographics Similar to Apache by Births to Unmarried Women
In terms of births to unmarried women, the demographic groups most similar to Apache are Dominican (39.8%, a difference of 0.060%), Immigrants from Caribbean (39.8%, a difference of 0.10%), African (39.7%, a difference of 0.38%), Immigrants from Dominican Republic (40.1%, a difference of 0.55%), and Immigrants from Bahamas (40.1%, a difference of 0.62%).
| Demographics | Rating | Rank | Births to Unmarried Women |
| Cubans | 0.0 /100 | #309 | Tragic 39.4% |
| Immigrants | Dominica | 0.0 /100 | #310 | Tragic 39.5% |
| Immigrants | Azores | 0.0 /100 | #311 | Tragic 39.6% |
| U.S. Virgin Islanders | 0.0 /100 | #312 | Tragic 39.6% |
| Africans | 0.0 /100 | #313 | Tragic 39.7% |
| Immigrants | Caribbean | 0.0 /100 | #314 | Tragic 39.8% |
| Dominicans | 0.0 /100 | #315 | Tragic 39.8% |
| Apache | 0.0 /100 | #316 | Tragic 39.9% |
| Immigrants | Dominican Republic | 0.0 /100 | #317 | Tragic 40.1% |
| Immigrants | Bahamas | 0.0 /100 | #318 | Tragic 40.1% |
| Yakama | 0.0 /100 | #319 | Tragic 40.3% |
| Crow | 0.0 /100 | #320 | Tragic 40.4% |
| Bahamians | 0.0 /100 | #321 | Tragic 40.8% |
| Cajuns | 0.0 /100 | #322 | Tragic 41.0% |
| Sioux | 0.0 /100 | #323 | Tragic 41.0% |