Scotch-Irish vs Indonesian Births to Unmarried Women
COMPARE
Scotch-Irish
Indonesian
Births to Unmarried Women
Births to Unmarried Women Comparison
Scotch-Irish
Indonesians
33.3%
BIRTHS TO UNMARRIED WOMEN
10.7/ 100
METRIC RATING
210th/ 347
METRIC RANK
35.0%
BIRTHS TO UNMARRIED WOMEN
1.2/ 100
METRIC RATING
242nd/ 347
METRIC RANK
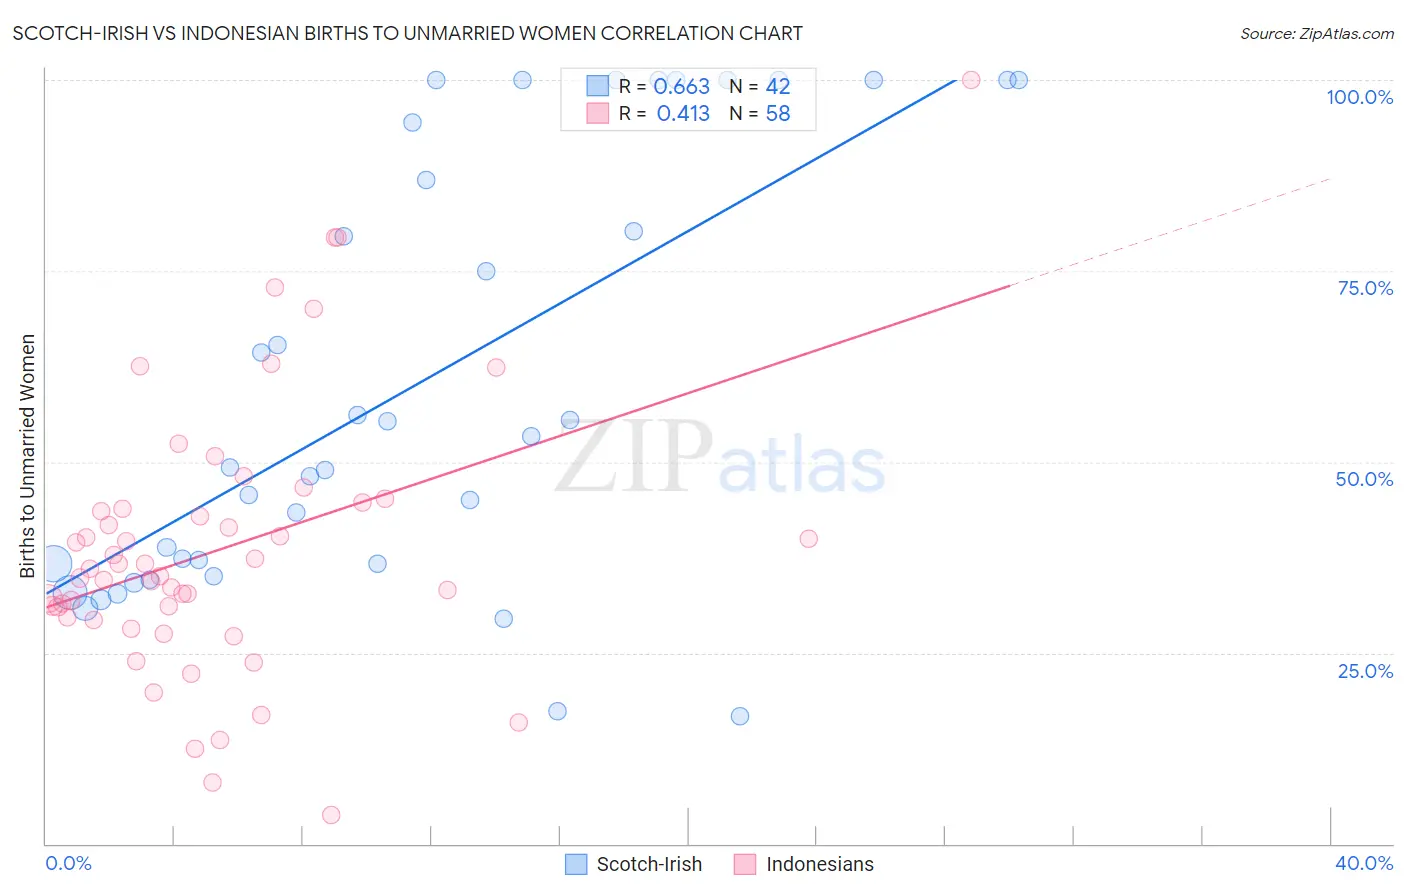
Scotch-Irish vs Indonesian Births to Unmarried Women Correlation Chart
The statistical analysis conducted on geographies consisting of 488,755,262 people shows a significant positive correlation between the proportion of Scotch-Irish and percentage of births to unmarried women in the United States with a correlation coefficient (R) of 0.663 and weighted average of 33.3%. Similarly, the statistical analysis conducted on geographies consisting of 158,009,570 people shows a moderate positive correlation between the proportion of Indonesians and percentage of births to unmarried women in the United States with a correlation coefficient (R) of 0.413 and weighted average of 35.0%, a difference of 5.2%.
Births to Unmarried Women Correlation Summary
| Measurement | Scotch-Irish | Indonesian |
| Minimum | 16.7% | 3.8% |
| Maximum | 100.0% | 100.0% |
| Range | 83.3% | 96.2% |
| Mean | 60.2% | 38.6% |
| Median | 51.3% | 35.5% |
| Interquartile 25% (IQ1) | 36.6% | 29.6% |
| Interquartile 75% (IQ3) | 94.4% | 43.8% |
| Interquartile Range (IQR) | 57.8% | 14.2% |
| Standard Deviation (Sample) | 28.1% | 17.8% |
| Standard Deviation (Population) | 27.8% | 17.7% |
Similar Demographics by Births to Unmarried Women
Demographics Similar to Scotch-Irish by Births to Unmarried Women
In terms of births to unmarried women, the demographic groups most similar to Scotch-Irish are White/Caucasian (33.3%, a difference of 0.0%), Ecuadorian (33.3%, a difference of 0.050%), Celtic (33.3%, a difference of 0.12%), Hawaiian (33.2%, a difference of 0.14%), and Immigrants from Sudan (33.2%, a difference of 0.17%).
| Demographics | Rating | Rank | Births to Unmarried Women |
| Ute | 14.4 /100 | #203 | Poor 33.0% |
| Immigrants | Africa | 14.3 /100 | #204 | Poor 33.0% |
| German Russians | 13.1 /100 | #205 | Poor 33.1% |
| Uruguayans | 12.8 /100 | #206 | Poor 33.1% |
| Immigrants | Sudan | 11.5 /100 | #207 | Poor 33.2% |
| Hawaiians | 11.3 /100 | #208 | Poor 33.2% |
| Whites/Caucasians | 10.7 /100 | #209 | Poor 33.3% |
| Scotch-Irish | 10.7 /100 | #210 | Poor 33.3% |
| Ecuadorians | 10.5 /100 | #211 | Poor 33.3% |
| Celtics | 10.2 /100 | #212 | Poor 33.3% |
| Immigrants | Costa Rica | 9.5 /100 | #213 | Tragic 33.4% |
| Slovaks | 9.3 /100 | #214 | Tragic 33.4% |
| French | 8.7 /100 | #215 | Tragic 33.4% |
| Nepalese | 7.8 /100 | #216 | Tragic 33.5% |
| Spaniards | 7.0 /100 | #217 | Tragic 33.6% |
Demographics Similar to Indonesians by Births to Unmarried Women
In terms of births to unmarried women, the demographic groups most similar to Indonesians are Immigrants from Guyana (35.0%, a difference of 0.10%), Immigrants from Middle Africa (34.9%, a difference of 0.13%), Sierra Leonean (34.9%, a difference of 0.38%), Japanese (35.2%, a difference of 0.49%), and Guyanese (35.2%, a difference of 0.55%).
| Demographics | Rating | Rank | Births to Unmarried Women |
| Immigrants | Ghana | 2.2 /100 | #235 | Tragic 34.5% |
| Immigrants | Cameroon | 1.6 /100 | #236 | Tragic 34.7% |
| Marshallese | 1.6 /100 | #237 | Tragic 34.8% |
| Immigrants | Cambodia | 1.6 /100 | #238 | Tragic 34.8% |
| Sierra Leoneans | 1.4 /100 | #239 | Tragic 34.9% |
| Immigrants | Middle Africa | 1.2 /100 | #240 | Tragic 34.9% |
| Immigrants | Guyana | 1.2 /100 | #241 | Tragic 35.0% |
| Indonesians | 1.2 /100 | #242 | Tragic 35.0% |
| Japanese | 0.9 /100 | #243 | Tragic 35.2% |
| Guyanese | 0.9 /100 | #244 | Tragic 35.2% |
| Shoshone | 0.8 /100 | #245 | Tragic 35.3% |
| Nigerians | 0.7 /100 | #246 | Tragic 35.3% |
| Immigrants | Nigeria | 0.7 /100 | #247 | Tragic 35.4% |
| Immigrants | Nonimmigrants | 0.6 /100 | #248 | Tragic 35.5% |
| Bermudans | 0.6 /100 | #249 | Tragic 35.5% |