Scotch-Irish vs Hungarian Births to Unmarried Women
COMPARE
Scotch-Irish
Hungarian
Births to Unmarried Women
Births to Unmarried Women Comparison
Scotch-Irish
Hungarians
33.3%
BIRTHS TO UNMARRIED WOMEN
10.7/ 100
METRIC RATING
210th/ 347
METRIC RANK
31.2%
BIRTHS TO UNMARRIED WOMEN
64.1/ 100
METRIC RATING
164th/ 347
METRIC RANK
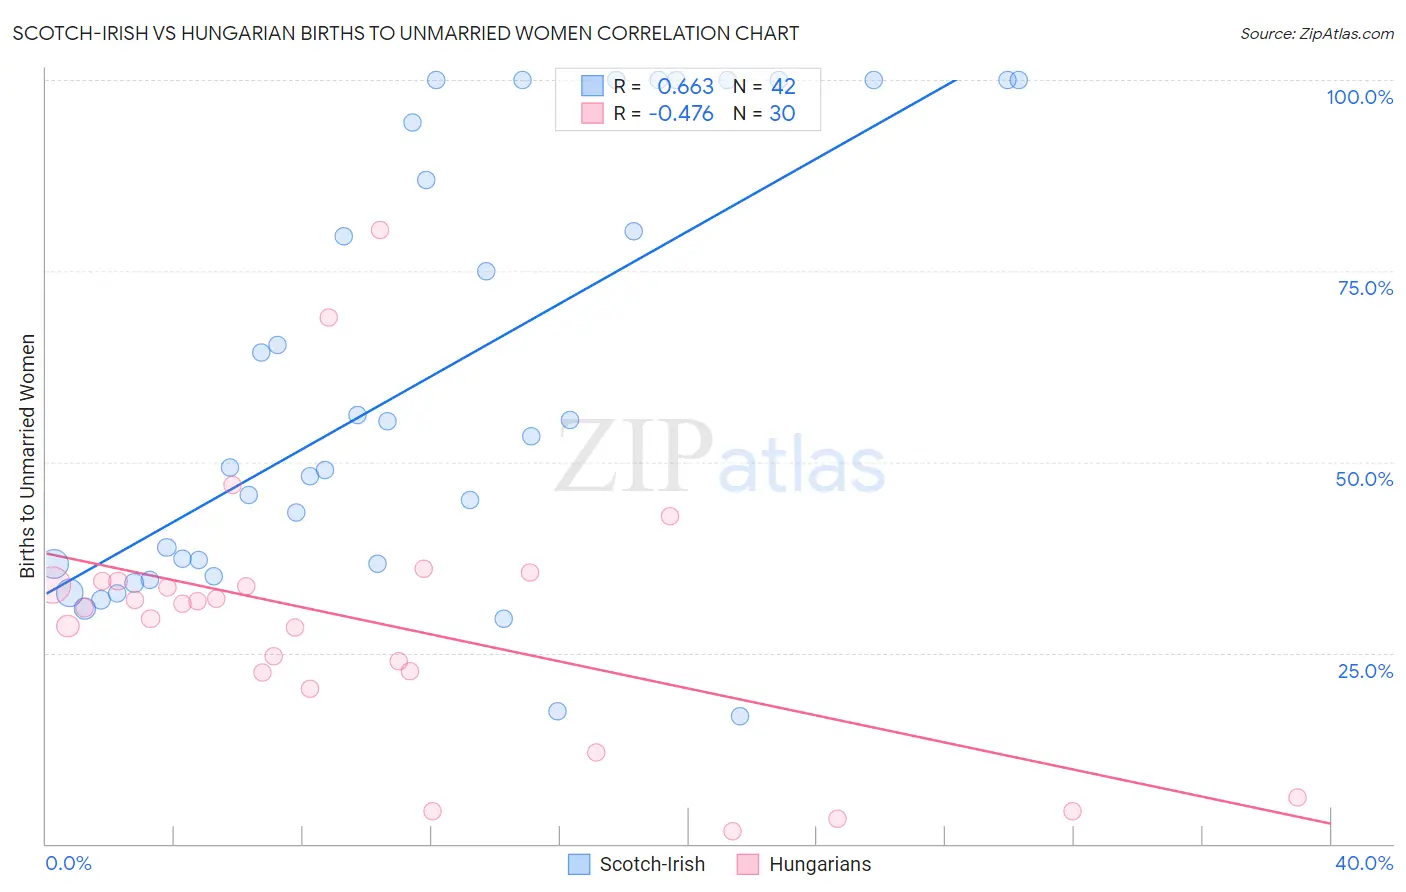
Scotch-Irish vs Hungarian Births to Unmarried Women Correlation Chart
The statistical analysis conducted on geographies consisting of 488,755,262 people shows a significant positive correlation between the proportion of Scotch-Irish and percentage of births to unmarried women in the United States with a correlation coefficient (R) of 0.663 and weighted average of 33.3%. Similarly, the statistical analysis conducted on geographies consisting of 440,971,373 people shows a moderate negative correlation between the proportion of Hungarians and percentage of births to unmarried women in the United States with a correlation coefficient (R) of -0.476 and weighted average of 31.2%, a difference of 6.5%.
Births to Unmarried Women Correlation Summary
| Measurement | Scotch-Irish | Hungarian |
| Minimum | 16.7% | 1.6% |
| Maximum | 100.0% | 80.4% |
| Range | 83.3% | 78.8% |
| Mean | 60.2% | 29.0% |
| Median | 51.3% | 31.2% |
| Interquartile 25% (IQ1) | 36.6% | 22.4% |
| Interquartile 75% (IQ3) | 94.4% | 34.3% |
| Interquartile Range (IQR) | 57.8% | 12.0% |
| Standard Deviation (Sample) | 28.1% | 17.3% |
| Standard Deviation (Population) | 27.8% | 17.0% |
Similar Demographics by Births to Unmarried Women
Demographics Similar to Scotch-Irish by Births to Unmarried Women
In terms of births to unmarried women, the demographic groups most similar to Scotch-Irish are White/Caucasian (33.3%, a difference of 0.0%), Ecuadorian (33.3%, a difference of 0.050%), Celtic (33.3%, a difference of 0.12%), Hawaiian (33.2%, a difference of 0.14%), and Immigrants from Sudan (33.2%, a difference of 0.17%).
| Demographics | Rating | Rank | Births to Unmarried Women |
| Ute | 14.4 /100 | #203 | Poor 33.0% |
| Immigrants | Africa | 14.3 /100 | #204 | Poor 33.0% |
| German Russians | 13.1 /100 | #205 | Poor 33.1% |
| Uruguayans | 12.8 /100 | #206 | Poor 33.1% |
| Immigrants | Sudan | 11.5 /100 | #207 | Poor 33.2% |
| Hawaiians | 11.3 /100 | #208 | Poor 33.2% |
| Whites/Caucasians | 10.7 /100 | #209 | Poor 33.3% |
| Scotch-Irish | 10.7 /100 | #210 | Poor 33.3% |
| Ecuadorians | 10.5 /100 | #211 | Poor 33.3% |
| Celtics | 10.2 /100 | #212 | Poor 33.3% |
| Immigrants | Costa Rica | 9.5 /100 | #213 | Tragic 33.4% |
| Slovaks | 9.3 /100 | #214 | Tragic 33.4% |
| French | 8.7 /100 | #215 | Tragic 33.4% |
| Nepalese | 7.8 /100 | #216 | Tragic 33.5% |
| Spaniards | 7.0 /100 | #217 | Tragic 33.6% |
Demographics Similar to Hungarians by Births to Unmarried Women
In terms of births to unmarried women, the demographic groups most similar to Hungarians are Immigrants from Chile (31.2%, a difference of 0.17%), Slovene (31.2%, a difference of 0.19%), Immigrants from Southern Europe (31.1%, a difference of 0.50%), Immigrants from England (31.1%, a difference of 0.57%), and Immigrants from Western Europe (31.1%, a difference of 0.57%).
| Demographics | Rating | Rank | Births to Unmarried Women |
| Immigrants | Eastern Africa | 72.1 /100 | #157 | Good 31.0% |
| Austrians | 69.9 /100 | #158 | Good 31.0% |
| Immigrants | England | 69.4 /100 | #159 | Good 31.1% |
| Immigrants | Western Europe | 69.3 /100 | #160 | Good 31.1% |
| Immigrants | Southern Europe | 68.7 /100 | #161 | Good 31.1% |
| Slovenes | 65.9 /100 | #162 | Good 31.2% |
| Immigrants | Chile | 65.7 /100 | #163 | Good 31.2% |
| Hungarians | 64.1 /100 | #164 | Good 31.2% |
| Immigrants | Somalia | 58.1 /100 | #165 | Average 31.4% |
| Peruvians | 55.5 /100 | #166 | Average 31.5% |
| Dutch | 55.3 /100 | #167 | Average 31.5% |
| Belgians | 52.4 /100 | #168 | Average 31.6% |
| Slavs | 52.0 /100 | #169 | Average 31.6% |
| Guamanians/Chamorros | 51.3 /100 | #170 | Average 31.6% |
| Finns | 50.5 /100 | #171 | Average 31.7% |