Tlingit-Haida vs Comanche Births to Unmarried Women
COMPARE
Tlingit-Haida
Comanche
Births to Unmarried Women
Births to Unmarried Women Comparison
Tlingit-Haida
Comanche
32.2%
BIRTHS TO UNMARRIED WOMEN
32.6/ 100
METRIC RATING
190th/ 347
METRIC RANK
36.7%
BIRTHS TO UNMARRIED WOMEN
0.1/ 100
METRIC RATING
268th/ 347
METRIC RANK
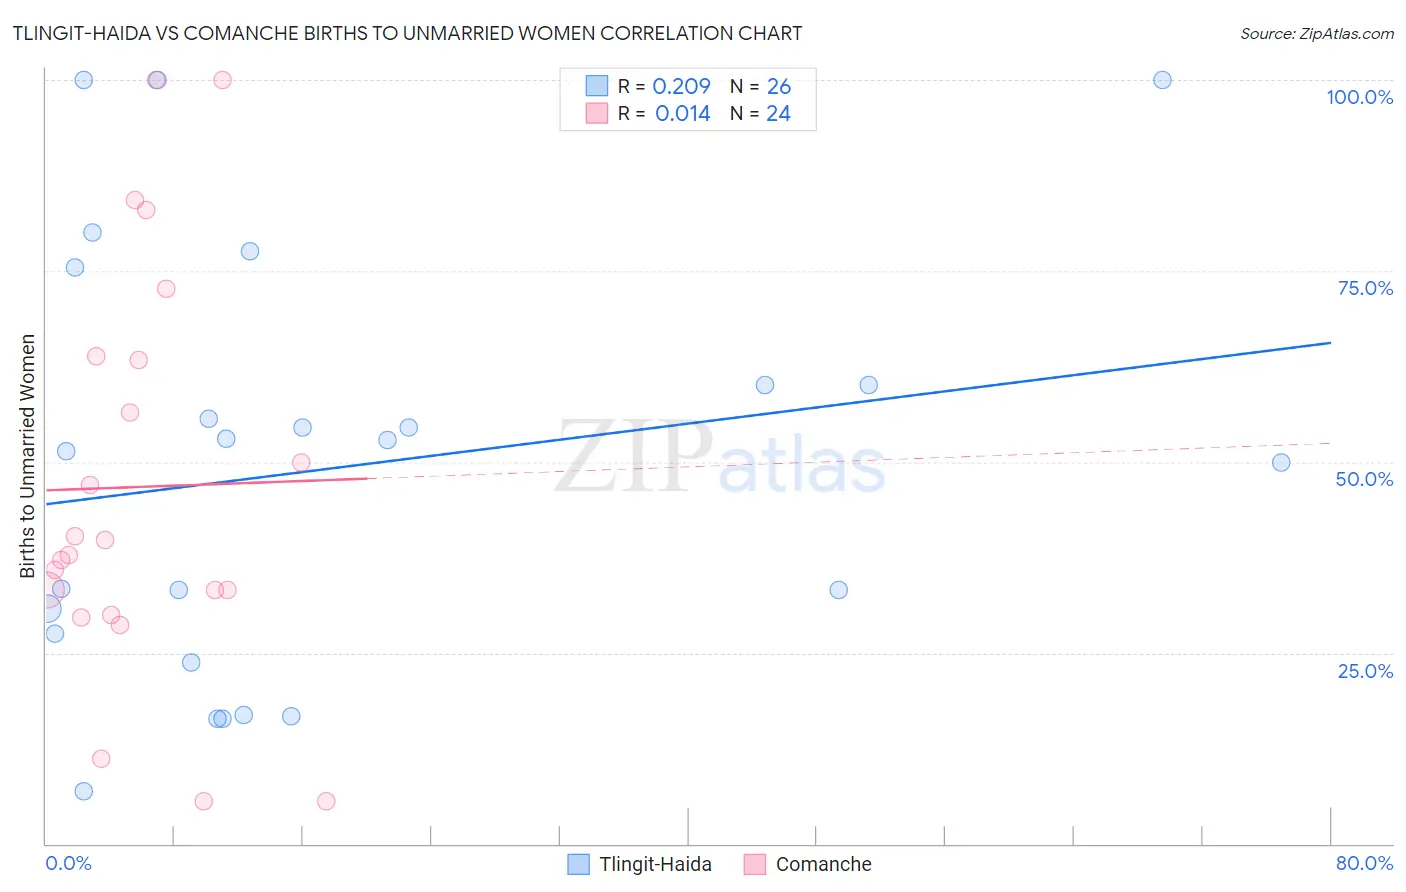
Tlingit-Haida vs Comanche Births to Unmarried Women Correlation Chart
The statistical analysis conducted on geographies consisting of 59,376,059 people shows a weak positive correlation between the proportion of Tlingit-Haida and percentage of births to unmarried women in the United States with a correlation coefficient (R) of 0.209 and weighted average of 32.2%. Similarly, the statistical analysis conducted on geographies consisting of 107,692,216 people shows no correlation between the proportion of Comanche and percentage of births to unmarried women in the United States with a correlation coefficient (R) of 0.014 and weighted average of 36.7%, a difference of 14.0%.
Births to Unmarried Women Correlation Summary
| Measurement | Tlingit-Haida | Comanche |
| Minimum | 6.9% | 5.6% |
| Maximum | 100.0% | 100.0% |
| Range | 93.1% | 94.4% |
| Mean | 49.2% | 46.7% |
| Median | 52.2% | 38.8% |
| Interquartile 25% (IQ1) | 27.6% | 31.6% |
| Interquartile 75% (IQ3) | 60.0% | 63.6% |
| Interquartile Range (IQR) | 32.4% | 32.0% |
| Standard Deviation (Sample) | 27.4% | 26.6% |
| Standard Deviation (Population) | 26.9% | 26.0% |
Similar Demographics by Births to Unmarried Women
Demographics Similar to Tlingit-Haida by Births to Unmarried Women
In terms of births to unmarried women, the demographic groups most similar to Tlingit-Haida are Irish (32.2%, a difference of 0.020%), Colombian (32.2%, a difference of 0.080%), Fijian (32.3%, a difference of 0.17%), Immigrants from Kenya (32.1%, a difference of 0.44%), and Osage (32.1%, a difference of 0.47%).
| Demographics | Rating | Rank | Births to Unmarried Women |
| Canadians | 41.4 /100 | #183 | Average 31.9% |
| Immigrants | South America | 40.7 /100 | #184 | Average 32.0% |
| Germans | 39.5 /100 | #185 | Fair 32.0% |
| Welsh | 38.2 /100 | #186 | Fair 32.0% |
| Czechoslovakians | 38.0 /100 | #187 | Fair 32.0% |
| Osage | 37.1 /100 | #188 | Fair 32.1% |
| Immigrants | Kenya | 36.9 /100 | #189 | Fair 32.1% |
| Tlingit-Haida | 32.6 /100 | #190 | Fair 32.2% |
| Irish | 32.4 /100 | #191 | Fair 32.2% |
| Colombians | 31.9 /100 | #192 | Fair 32.2% |
| Fijians | 31.1 /100 | #193 | Fair 32.3% |
| Sudanese | 27.3 /100 | #194 | Fair 32.4% |
| Samoans | 21.9 /100 | #195 | Fair 32.6% |
| Immigrants | Colombia | 21.7 /100 | #196 | Fair 32.6% |
| Immigrants | Immigrants | 20.6 /100 | #197 | Fair 32.7% |
Demographics Similar to Comanche by Births to Unmarried Women
In terms of births to unmarried women, the demographic groups most similar to Comanche are Central American (36.7%, a difference of 0.010%), Immigrants from Senegal (36.7%, a difference of 0.080%), Senegalese (36.8%, a difference of 0.12%), Cherokee (36.7%, a difference of 0.13%), and Subsaharan African (36.7%, a difference of 0.18%).
| Demographics | Rating | Rank | Births to Unmarried Women |
| Trinidadians and Tobagonians | 0.2 /100 | #261 | Tragic 36.5% |
| French American Indians | 0.1 /100 | #262 | Tragic 36.6% |
| Nicaraguans | 0.1 /100 | #263 | Tragic 36.6% |
| Sub-Saharan Africans | 0.1 /100 | #264 | Tragic 36.7% |
| Cherokee | 0.1 /100 | #265 | Tragic 36.7% |
| Immigrants | Senegal | 0.1 /100 | #266 | Tragic 36.7% |
| Central Americans | 0.1 /100 | #267 | Tragic 36.7% |
| Comanche | 0.1 /100 | #268 | Tragic 36.7% |
| Senegalese | 0.1 /100 | #269 | Tragic 36.8% |
| Immigrants | Congo | 0.1 /100 | #270 | Tragic 36.8% |
| Immigrants | Barbados | 0.1 /100 | #271 | Tragic 36.8% |
| Choctaw | 0.1 /100 | #272 | Tragic 36.9% |
| Mexicans | 0.1 /100 | #273 | Tragic 36.9% |
| Cree | 0.1 /100 | #274 | Tragic 37.0% |
| Barbadians | 0.1 /100 | #275 | Tragic 37.0% |