Scotch-Irish vs Immigrants from Japan Births to Unmarried Women
COMPARE
Scotch-Irish
Immigrants from Japan
Births to Unmarried Women
Births to Unmarried Women Comparison
Scotch-Irish
Immigrants from Japan
33.3%
BIRTHS TO UNMARRIED WOMEN
10.7/ 100
METRIC RATING
210th/ 347
METRIC RANK
26.4%
BIRTHS TO UNMARRIED WOMEN
99.9/ 100
METRIC RATING
23rd/ 347
METRIC RANK
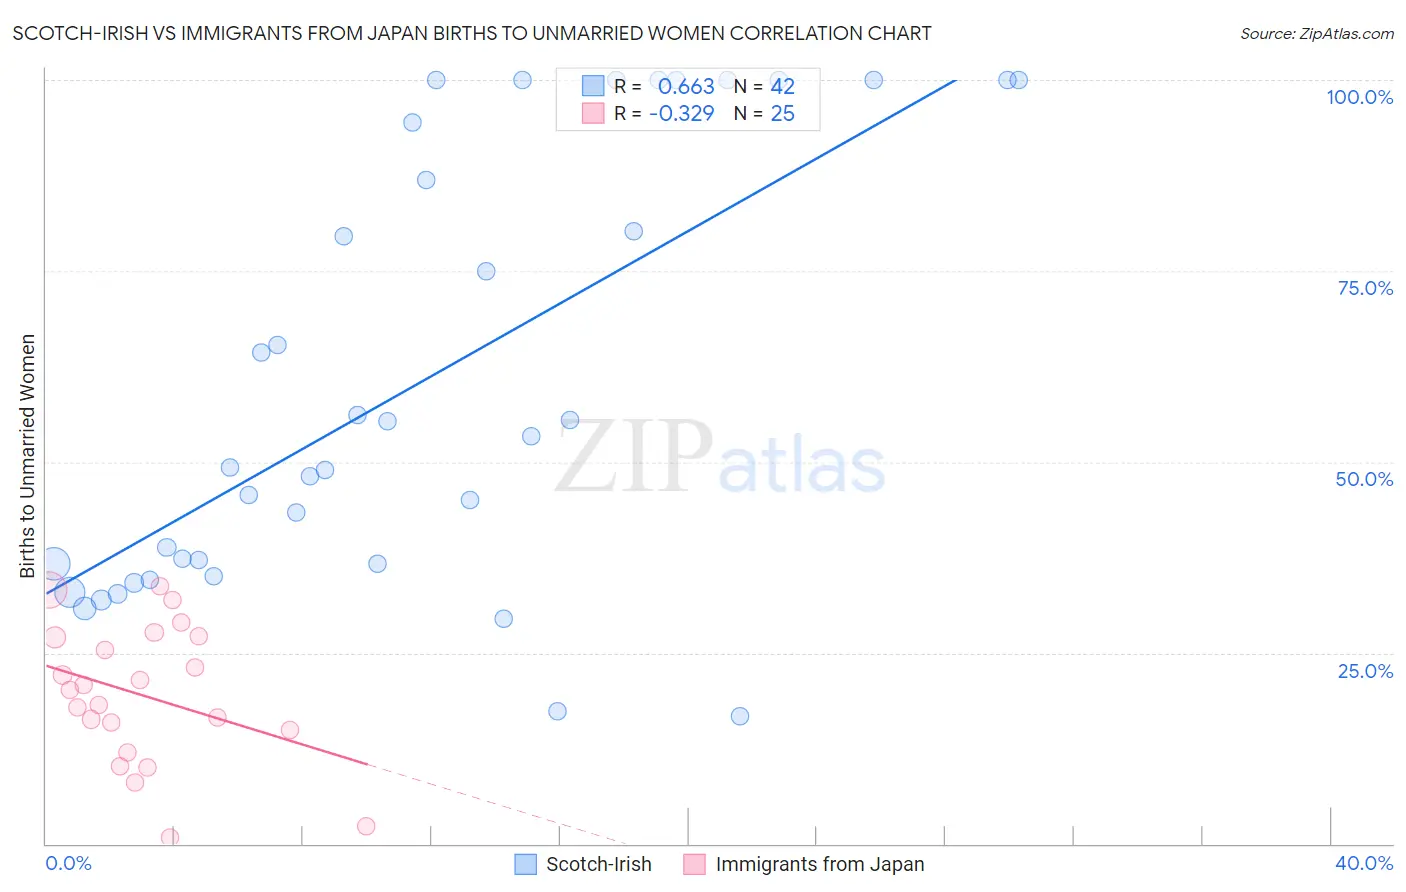
Scotch-Irish vs Immigrants from Japan Births to Unmarried Women Correlation Chart
The statistical analysis conducted on geographies consisting of 488,755,262 people shows a significant positive correlation between the proportion of Scotch-Irish and percentage of births to unmarried women in the United States with a correlation coefficient (R) of 0.663 and weighted average of 33.3%. Similarly, the statistical analysis conducted on geographies consisting of 319,959,110 people shows a mild negative correlation between the proportion of Immigrants from Japan and percentage of births to unmarried women in the United States with a correlation coefficient (R) of -0.329 and weighted average of 26.4%, a difference of 25.9%.
Births to Unmarried Women Correlation Summary
| Measurement | Scotch-Irish | Immigrants from Japan |
| Minimum | 16.7% | 0.80% |
| Maximum | 100.0% | 33.8% |
| Range | 83.3% | 33.0% |
| Mean | 60.2% | 19.4% |
| Median | 51.3% | 20.2% |
| Interquartile 25% (IQ1) | 36.6% | 13.4% |
| Interquartile 75% (IQ3) | 94.4% | 27.1% |
| Interquartile Range (IQR) | 57.8% | 13.7% |
| Standard Deviation (Sample) | 28.1% | 9.0% |
| Standard Deviation (Population) | 27.8% | 8.8% |
Similar Demographics by Births to Unmarried Women
Demographics Similar to Scotch-Irish by Births to Unmarried Women
In terms of births to unmarried women, the demographic groups most similar to Scotch-Irish are White/Caucasian (33.3%, a difference of 0.0%), Ecuadorian (33.3%, a difference of 0.050%), Celtic (33.3%, a difference of 0.12%), Hawaiian (33.2%, a difference of 0.14%), and Immigrants from Sudan (33.2%, a difference of 0.17%).
| Demographics | Rating | Rank | Births to Unmarried Women |
| Ute | 14.4 /100 | #203 | Poor 33.0% |
| Immigrants | Africa | 14.3 /100 | #204 | Poor 33.0% |
| German Russians | 13.1 /100 | #205 | Poor 33.1% |
| Uruguayans | 12.8 /100 | #206 | Poor 33.1% |
| Immigrants | Sudan | 11.5 /100 | #207 | Poor 33.2% |
| Hawaiians | 11.3 /100 | #208 | Poor 33.2% |
| Whites/Caucasians | 10.7 /100 | #209 | Poor 33.3% |
| Scotch-Irish | 10.7 /100 | #210 | Poor 33.3% |
| Ecuadorians | 10.5 /100 | #211 | Poor 33.3% |
| Celtics | 10.2 /100 | #212 | Poor 33.3% |
| Immigrants | Costa Rica | 9.5 /100 | #213 | Tragic 33.4% |
| Slovaks | 9.3 /100 | #214 | Tragic 33.4% |
| French | 8.7 /100 | #215 | Tragic 33.4% |
| Nepalese | 7.8 /100 | #216 | Tragic 33.5% |
| Spaniards | 7.0 /100 | #217 | Tragic 33.6% |
Demographics Similar to Immigrants from Japan by Births to Unmarried Women
In terms of births to unmarried women, the demographic groups most similar to Immigrants from Japan are Burmese (26.4%, a difference of 0.19%), Soviet Union (26.3%, a difference of 0.41%), Immigrants from Korea (26.3%, a difference of 0.55%), Armenian (26.2%, a difference of 0.76%), and Immigrants from Australia (26.6%, a difference of 0.79%).
| Demographics | Rating | Rank | Births to Unmarried Women |
| Immigrants | Belarus | 100.0 /100 | #16 | Exceptional 25.6% |
| Immigrants | Uzbekistan | 100.0 /100 | #17 | Exceptional 25.8% |
| Immigrants | Armenia | 99.9 /100 | #18 | Exceptional 26.1% |
| Armenians | 99.9 /100 | #19 | Exceptional 26.2% |
| Immigrants | Korea | 99.9 /100 | #20 | Exceptional 26.3% |
| Soviet Union | 99.9 /100 | #21 | Exceptional 26.3% |
| Burmese | 99.9 /100 | #22 | Exceptional 26.4% |
| Immigrants | Japan | 99.9 /100 | #23 | Exceptional 26.4% |
| Immigrants | Australia | 99.9 /100 | #24 | Exceptional 26.6% |
| Cambodians | 99.9 /100 | #25 | Exceptional 26.7% |
| Asians | 99.9 /100 | #26 | Exceptional 26.8% |
| Immigrants | Asia | 99.9 /100 | #27 | Exceptional 26.8% |
| Okinawans | 99.8 /100 | #28 | Exceptional 26.9% |
| Cypriots | 99.8 /100 | #29 | Exceptional 27.0% |
| Bulgarians | 99.8 /100 | #30 | Exceptional 27.1% |