Scotch-Irish vs Immigrants from Fiji Births to Unmarried Women
COMPARE
Scotch-Irish
Immigrants from Fiji
Births to Unmarried Women
Births to Unmarried Women Comparison
Scotch-Irish
Immigrants from Fiji
33.3%
BIRTHS TO UNMARRIED WOMEN
10.7/ 100
METRIC RATING
210th/ 347
METRIC RANK
29.2%
BIRTHS TO UNMARRIED WOMEN
96.6/ 100
METRIC RATING
91st/ 347
METRIC RANK
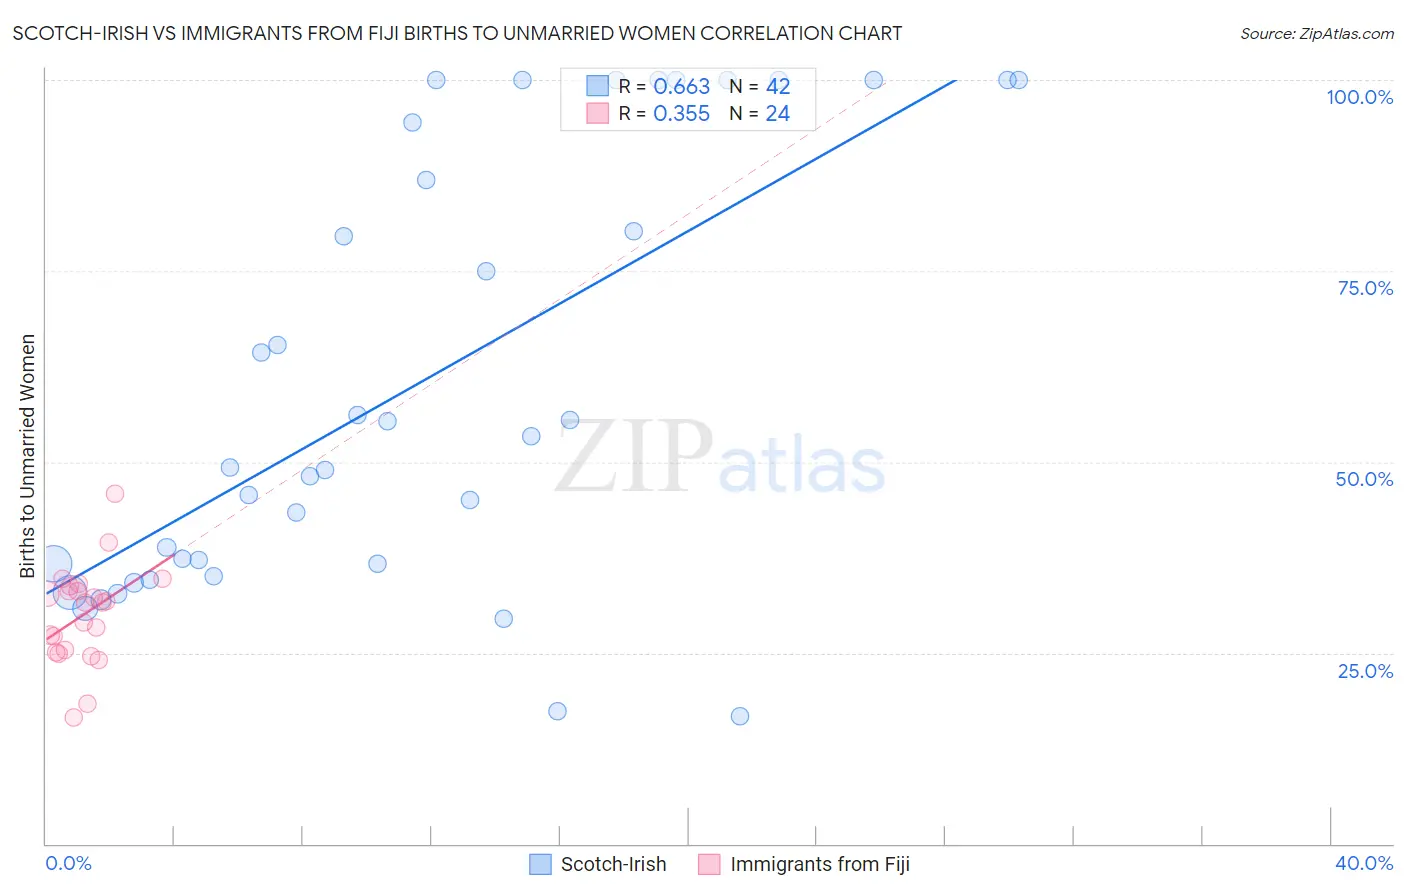
Scotch-Irish vs Immigrants from Fiji Births to Unmarried Women Correlation Chart
The statistical analysis conducted on geographies consisting of 488,755,262 people shows a significant positive correlation between the proportion of Scotch-Irish and percentage of births to unmarried women in the United States with a correlation coefficient (R) of 0.663 and weighted average of 33.3%. Similarly, the statistical analysis conducted on geographies consisting of 91,931,577 people shows a mild positive correlation between the proportion of Immigrants from Fiji and percentage of births to unmarried women in the United States with a correlation coefficient (R) of 0.355 and weighted average of 29.2%, a difference of 14.0%.
Births to Unmarried Women Correlation Summary
| Measurement | Scotch-Irish | Immigrants from Fiji |
| Minimum | 16.7% | 16.5% |
| Maximum | 100.0% | 45.9% |
| Range | 83.3% | 29.3% |
| Mean | 60.2% | 30.0% |
| Median | 51.3% | 31.6% |
| Interquartile 25% (IQ1) | 36.6% | 25.2% |
| Interquartile 75% (IQ3) | 94.4% | 33.4% |
| Interquartile Range (IQR) | 57.8% | 8.1% |
| Standard Deviation (Sample) | 28.1% | 6.3% |
| Standard Deviation (Population) | 27.8% | 6.2% |
Similar Demographics by Births to Unmarried Women
Demographics Similar to Scotch-Irish by Births to Unmarried Women
In terms of births to unmarried women, the demographic groups most similar to Scotch-Irish are White/Caucasian (33.3%, a difference of 0.0%), Ecuadorian (33.3%, a difference of 0.050%), Celtic (33.3%, a difference of 0.12%), Hawaiian (33.2%, a difference of 0.14%), and Immigrants from Sudan (33.2%, a difference of 0.17%).
| Demographics | Rating | Rank | Births to Unmarried Women |
| Ute | 14.4 /100 | #203 | Poor 33.0% |
| Immigrants | Africa | 14.3 /100 | #204 | Poor 33.0% |
| German Russians | 13.1 /100 | #205 | Poor 33.1% |
| Uruguayans | 12.8 /100 | #206 | Poor 33.1% |
| Immigrants | Sudan | 11.5 /100 | #207 | Poor 33.2% |
| Hawaiians | 11.3 /100 | #208 | Poor 33.2% |
| Whites/Caucasians | 10.7 /100 | #209 | Poor 33.3% |
| Scotch-Irish | 10.7 /100 | #210 | Poor 33.3% |
| Ecuadorians | 10.5 /100 | #211 | Poor 33.3% |
| Celtics | 10.2 /100 | #212 | Poor 33.3% |
| Immigrants | Costa Rica | 9.5 /100 | #213 | Tragic 33.4% |
| Slovaks | 9.3 /100 | #214 | Tragic 33.4% |
| French | 8.7 /100 | #215 | Tragic 33.4% |
| Nepalese | 7.8 /100 | #216 | Tragic 33.5% |
| Spaniards | 7.0 /100 | #217 | Tragic 33.6% |
Demographics Similar to Immigrants from Fiji by Births to Unmarried Women
In terms of births to unmarried women, the demographic groups most similar to Immigrants from Fiji are Arab (29.2%, a difference of 0.040%), Estonian (29.2%, a difference of 0.080%), Ukrainian (29.2%, a difference of 0.20%), Immigrants from Latvia (29.1%, a difference of 0.21%), and Immigrants from Vietnam (29.3%, a difference of 0.34%).
| Demographics | Rating | Rank | Births to Unmarried Women |
| Immigrants | Poland | 97.6 /100 | #84 | Exceptional 28.9% |
| Sri Lankans | 97.5 /100 | #85 | Exceptional 28.9% |
| Immigrants | Jordan | 97.4 /100 | #86 | Exceptional 29.0% |
| Taiwanese | 97.3 /100 | #87 | Exceptional 29.0% |
| Immigrants | France | 97.3 /100 | #88 | Exceptional 29.0% |
| Immigrants | Saudi Arabia | 97.0 /100 | #89 | Exceptional 29.1% |
| Immigrants | Latvia | 96.8 /100 | #90 | Exceptional 29.1% |
| Immigrants | Fiji | 96.6 /100 | #91 | Exceptional 29.2% |
| Arabs | 96.5 /100 | #92 | Exceptional 29.2% |
| Estonians | 96.5 /100 | #93 | Exceptional 29.2% |
| Ukrainians | 96.3 /100 | #94 | Exceptional 29.2% |
| Immigrants | Vietnam | 96.1 /100 | #95 | Exceptional 29.3% |
| Norwegians | 95.8 /100 | #96 | Exceptional 29.3% |
| Immigrants | South Africa | 95.7 /100 | #97 | Exceptional 29.3% |
| Immigrants | Syria | 95.7 /100 | #98 | Exceptional 29.4% |