Immigrants from Northern Europe vs Russian Currently Married
COMPARE
Immigrants from Northern Europe
Russian
Currently Married
Currently Married Comparison
Immigrants from Northern Europe
Russians
48.8%
CURRENTLY MARRIED
99.4/ 100
METRIC RATING
35th/ 347
METRIC RANK
48.6%
CURRENTLY MARRIED
98.9/ 100
METRIC RATING
52nd/ 347
METRIC RANK
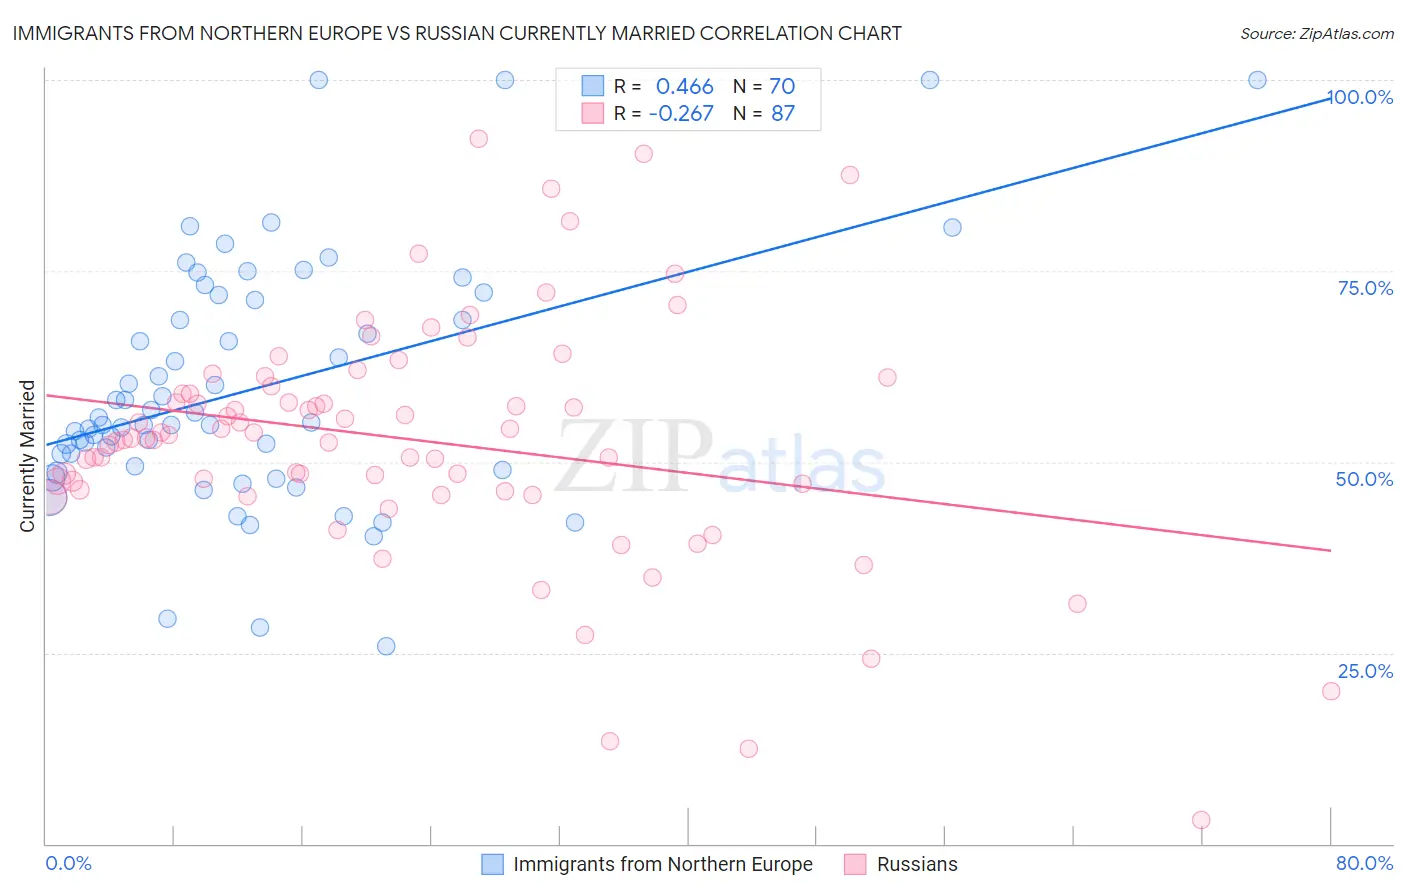
Immigrants from Northern Europe vs Russian Currently Married Correlation Chart
The statistical analysis conducted on geographies consisting of 477,179,061 people shows a moderate positive correlation between the proportion of Immigrants from Northern Europe and percentage of population currently married in the United States with a correlation coefficient (R) of 0.466 and weighted average of 48.8%. Similarly, the statistical analysis conducted on geographies consisting of 512,168,988 people shows a weak negative correlation between the proportion of Russians and percentage of population currently married in the United States with a correlation coefficient (R) of -0.267 and weighted average of 48.6%, a difference of 0.56%.
Currently Married Correlation Summary
| Measurement | Immigrants from Northern Europe | Russian |
| Minimum | 25.8% | 3.1% |
| Maximum | 100.0% | 92.3% |
| Range | 74.2% | 89.2% |
| Mean | 59.6% | 52.9% |
| Median | 55.0% | 53.1% |
| Interquartile 25% (IQ1) | 49.4% | 46.3% |
| Interquartile 75% (IQ3) | 71.2% | 59.8% |
| Interquartile Range (IQR) | 21.8% | 13.5% |
| Standard Deviation (Sample) | 16.0% | 15.7% |
| Standard Deviation (Population) | 15.9% | 15.6% |
Demographics Similar to Immigrants from Northern Europe and Russians by Currently Married
In terms of currently married, the demographic groups most similar to Immigrants from Northern Europe are Italian (48.8%, a difference of 0.010%), Hungarian (48.8%, a difference of 0.010%), Immigrants from Lithuania (48.8%, a difference of 0.020%), Czechoslovakian (48.8%, a difference of 0.050%), and Irish (48.9%, a difference of 0.080%). Similarly, the demographic groups most similar to Russians are Iranian (48.6%, a difference of 0.090%), White/Caucasian (48.6%, a difference of 0.090%), Immigrants from Austria (48.5%, a difference of 0.12%), Bhutanese (48.6%, a difference of 0.16%), and Austrian (48.7%, a difference of 0.28%).
| Demographics | Rating | Rank | Currently Married |
| Irish | 99.5 /100 | #33 | Exceptional 48.9% |
| Immigrants | Lithuania | 99.4 /100 | #34 | Exceptional 48.8% |
| Immigrants | Northern Europe | 99.4 /100 | #35 | Exceptional 48.8% |
| Italians | 99.4 /100 | #36 | Exceptional 48.8% |
| Hungarians | 99.4 /100 | #37 | Exceptional 48.8% |
| Czechoslovakians | 99.4 /100 | #38 | Exceptional 48.8% |
| British | 99.4 /100 | #39 | Exceptional 48.8% |
| Immigrants | Canada | 99.4 /100 | #40 | Exceptional 48.8% |
| Greeks | 99.3 /100 | #41 | Exceptional 48.8% |
| Finns | 99.3 /100 | #42 | Exceptional 48.8% |
| Scotch-Irish | 99.3 /100 | #43 | Exceptional 48.7% |
| Immigrants | North America | 99.3 /100 | #44 | Exceptional 48.7% |
| Belgians | 99.3 /100 | #45 | Exceptional 48.7% |
| Immigrants | Iran | 99.2 /100 | #46 | Exceptional 48.7% |
| Northern Europeans | 99.2 /100 | #47 | Exceptional 48.7% |
| Austrians | 99.2 /100 | #48 | Exceptional 48.7% |
| Bhutanese | 99.1 /100 | #49 | Exceptional 48.6% |
| Iranians | 99.0 /100 | #50 | Exceptional 48.6% |
| Whites/Caucasians | 99.0 /100 | #51 | Exceptional 48.6% |
| Russians | 98.9 /100 | #52 | Exceptional 48.6% |
| Immigrants | Austria | 98.8 /100 | #53 | Exceptional 48.5% |