Immigrants from Northern Europe vs Immigrants from the Azores Currently Married

COMPARE

Immigrants from Northern Europe
Race
Ancestry
AfghanAfricanAlaska NativeAlaskan AthabascanAlbanianAleutAlsatianAmericanApacheArabArapahoArgentineanArmenianAssyrian/Chaldean/SyriacAustralianAustrianBahamianBangladeshiBarbadianBasqueBelgianBelizeanBermudanBhutaneseBlackfeetBolivianBrazilianBritishBritish West IndianBulgarianBurmeseCajunCambodianCanadianCape VerdeanCarpatho RusynCelticCentral AmericanCentral American IndianCherokeeCheyenneChickasawChileanChineseChippewaChoctawColombianColvilleComancheCosta RicanCreeCreekCroatianCrowCubanCypriotCzechCzechoslovakianDanishDelawareDominicanDutchDutch West IndianEastern EuropeanEcuadorianEgyptianEnglishEstonianEthiopianEuropeanFijianFilipinoFinnishFrenchFrench American IndianFrench CanadianGermanGerman RussianGhanaianGreekGuamanian/ChamorroGuatemalanGuyaneseHaitianHmongHonduranHopiHoumaHungarianIcelanderIndian (Asian)IndonesianInupiatIranianIraqiIrishIroquoisIsraeliItalianJamaicanJapaneseJordanianKenyanKiowaKoreanLaotianLatvianLebaneseLiberianLithuanianLumbeeLuxembourgerMacedonianMalaysianMalteseMarshalleseMenomineeMexicanMexican American IndianMongolianMoroccanNative HawaiianNavajoNepaleseNew ZealanderNicaraguanNigerianNorthern EuropeanNorwegianOkinawanOsageOttawaPaiutePakistaniPalestinianPanamanianParaguayanPennsylvania GermanPeruvianPimaPolishPortuguesePotawatomiPuebloPuerto RicanPuget Sound SalishRomanianRussianSalvadoranSamoanScandinavianScotch-IrishScottishSeminoleSenegaleseSerbianShoshoneSierra LeoneanSiouxSlavicSlovakSloveneSomaliSouth AfricanSouth AmericanSouth American IndianSoviet UnionSpaniardSpanishSpanish AmericanSpanish American IndianSri LankanSubsaharan AfricanSudaneseSwedishSwissSyrianTaiwaneseThaiTlingit-HaidaTohono O'OdhamTonganTrinidadian and TobagonianTsimshianTurkishU.S. Virgin IslanderUgandanUkrainianUruguayanUteVenezuelanVietnameseWelshWest IndianYakamaYaquiYugoslavianYumanYup'ikZimbabwean
Immigration
NonimmigrantsImmigrantsAfghanistanAfricaAlbaniaArgentinaArmeniaAsiaAustraliaAustriaBahamasBangladeshBarbadosBelarusBelgiumBelizeBoliviaBosnia and HerzegovinaBrazilBulgariaBurma/MyanmarCabo VerdeCambodiaCameroonCanadaCaribbeanCentral AmericaChileChinaColombiaCongoCosta RicaCroatiaCubaCzechoslovakiaDenmarkDominicaDominican RepublicEastern AfricaEastern AsiaEastern EuropeEcuadorEgyptEl SalvadorEnglandEritreaEthiopiaEuropeFijiFranceGermanyGhanaGreeceGrenadaGuatemalaGuyanaHaitiHondurasHong KongHungaryIndiaIndonesiaIranIraqIrelandIsraelItalyJamaicaJapanJordanKazakhstanKenyaKoreaKuwaitLaosLatin AmericaLatviaLebanonLiberiaLithuaniaMalaysiaMexicoMicronesiaMiddle AfricaMoldovaMoroccoNepalNetherlandsNicaraguaNigeriaNorth AmericaNorth MacedoniaNorthern AfricaNorthern EuropeNorwayOceaniaPakistanPanamaPeruPhilippinesPolandPortugalRomaniaRussiaSaudi ArabiaScotlandSenegalSerbiaSierra LeoneSingaporeSomaliaSouth AfricaSouth AmericaSouth Central AsiaSouth Eastern AsiaSouthern EuropeSpainSri LankaSt. Vincent and the GrenadinesSudanSwedenSwitzerlandSyriaTaiwanThailandTrinidad and TobagoTurkeyUgandaUkraineUruguayUzbekistanVenezuelaVietnamWest IndiesWestern AfricaWestern AsiaWestern EuropeYemenZaireZimbabwe
Immigrants from the Azores
Race
Ancestry
AfghanAfricanAlaska NativeAlaskan AthabascanAlbanianAleutAlsatianAmericanApacheArabArapahoArgentineanArmenianAssyrian/Chaldean/SyriacAustralianAustrianBahamianBangladeshiBarbadianBasqueBelgianBelizeanBermudanBhutaneseBlackfeetBolivianBrazilianBritishBritish West IndianBulgarianBurmeseCajunCambodianCanadianCape VerdeanCarpatho RusynCelticCentral AmericanCentral American IndianCherokeeCheyenneChickasawChileanChineseChippewaChoctawColombianColvilleComancheCosta RicanCreeCreekCroatianCrowCubanCypriotCzechCzechoslovakianDanishDelawareDominicanDutchDutch West IndianEastern EuropeanEcuadorianEgyptianEnglishEstonianEthiopianEuropeanFijianFilipinoFinnishFrenchFrench American IndianFrench CanadianGermanGerman RussianGhanaianGreekGuamanian/ChamorroGuatemalanGuyaneseHaitianHmongHonduranHopiHoumaHungarianIcelanderIndian (Asian)IndonesianInupiatIranianIraqiIrishIroquoisIsraeliItalianJamaicanJapaneseJordanianKenyanKiowaKoreanLaotianLatvianLebaneseLiberianLithuanianLumbeeLuxembourgerMacedonianMalaysianMalteseMarshalleseMenomineeMexicanMexican American IndianMongolianMoroccanNative HawaiianNavajoNepaleseNew ZealanderNicaraguanNigerianNorthern EuropeanNorwegianOkinawanOsageOttawaPaiutePakistaniPalestinianPanamanianParaguayanPennsylvania GermanPeruvianPimaPolishPortuguesePotawatomiPuebloPuerto RicanPuget Sound SalishRomanianRussianSalvadoranSamoanScandinavianScotch-IrishScottishSeminoleSenegaleseSerbianShoshoneSierra LeoneanSiouxSlavicSlovakSloveneSomaliSouth AfricanSouth AmericanSouth American IndianSoviet UnionSpaniardSpanishSpanish AmericanSpanish American IndianSri LankanSubsaharan AfricanSudaneseSwedishSwissSyrianTaiwaneseThaiTlingit-HaidaTohono O'OdhamTonganTrinidadian and TobagonianTsimshianTurkishU.S. Virgin IslanderUgandanUkrainianUruguayanUteVenezuelanVietnameseWelshWest IndianYakamaYaquiYugoslavianYumanYup'ikZimbabwean
Immigration
NonimmigrantsImmigrantsAfghanistanAfricaAlbaniaArgentinaArmeniaAsiaAustraliaAustriaBahamasBangladeshBarbadosBelarusBelgiumBelizeBoliviaBosnia and HerzegovinaBrazilBulgariaBurma/MyanmarCabo VerdeCambodiaCameroonCanadaCaribbeanCentral AmericaChileChinaColombiaCongoCosta RicaCroatiaCubaCzechoslovakiaDenmarkDominicaDominican RepublicEastern AfricaEastern AsiaEastern EuropeEcuadorEgyptEl SalvadorEnglandEritreaEthiopiaEuropeFijiFranceGermanyGhanaGreeceGrenadaGuatemalaGuyanaHaitiHondurasHong KongHungaryIndiaIndonesiaIranIraqIrelandIsraelItalyJamaicaJapanJordanKazakhstanKenyaKoreaKuwaitLaosLatin AmericaLatviaLebanonLiberiaLithuaniaMalaysiaMexicoMicronesiaMiddle AfricaMoldovaMoroccoNepalNetherlandsNicaraguaNigeriaNorth AmericaNorth MacedoniaNorthern AfricaNorwayOceaniaPakistanPanamaPeruPhilippinesPolandPortugalRomaniaRussiaSaudi ArabiaScotlandSenegalSerbiaSierra LeoneSingaporeSomaliaSouth AfricaSouth AmericaSouth Central AsiaSouth Eastern AsiaSouthern EuropeSpainSri LankaSt. Vincent and the GrenadinesSudanSwedenSwitzerlandSyriaTaiwanThailandTrinidad and TobagoTurkeyUgandaUkraineUruguayUzbekistanVenezuelaVietnamWest IndiesWestern AfricaWestern AsiaWestern EuropeYemenZaireZimbabweAzores
Currently Married
Income
Poverty
Unemployment
Labor Participation
Family Structure
Vehicle Availability
Education Level
Disability

Currently Married Comparison

Immigrants from Northern Europe

Immigrants from the Azores

Exceptional
Tragic
48.8%
CURRENTLY MARRIED
99.4/ 100
METRIC RATING
35th/ 347
METRIC RANK
45.1%
CURRENTLY MARRIED
2.5/ 100
METRIC RATING
222nd/ 347
METRIC RANK

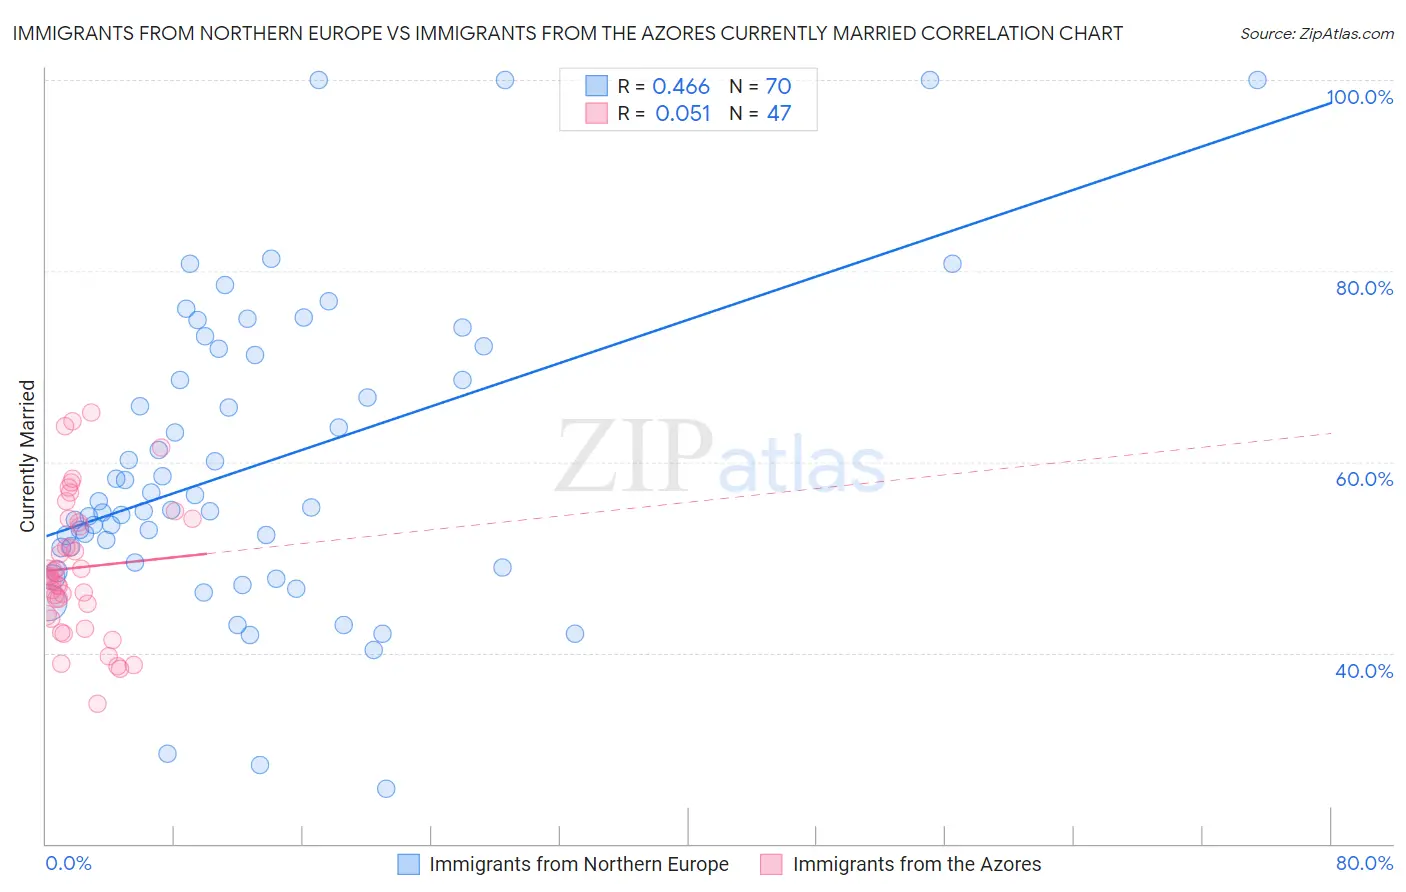
Immigrants from Northern Europe vs Immigrants from the Azores Currently Married Correlation Chart

The statistical analysis conducted on geographies consisting of 477,179,061 people shows a moderate positive correlation between the proportion of Immigrants from Northern Europe and percentage of population currently married in the United States with a correlation coefficient (R) of 0.466 and weighted average of 48.8%. Similarly, the statistical analysis conducted on geographies consisting of 46,256,915 people shows a slight positive correlation between the proportion of Immigrants from the Azores and percentage of population currently married in the United States with a correlation coefficient (R) of 0.051 and weighted average of 45.1%, a difference of 8.4%.
Immigrants from Northern Europe vs Immigrants from the Azores Currently Married

Currently Married Correlation Summary

MeasurementImmigrants from Northern EuropeImmigrants from the Azores
Minimum25.8%34.6%
Maximum100.0%65.2%
Range74.2%30.6%
Mean59.6%48.9%
Median55.0%47.9%
Interquartile 25% (IQ1)49.4%43.9%
Interquartile 75% (IQ3)71.2%54.0%
Interquartile Range (IQR)21.8%10.1%
Standard Deviation (Sample)16.0%7.2%
Standard Deviation (Population)15.9%7.2%

Similar Demographics by Currently Married

Demographics Similar to Immigrants from Northern Europe by Currently Married

In terms of currently married, the demographic groups most similar to Immigrants from Northern Europe are Italian (48.8%, a difference of 0.010%), Hungarian (48.8%, a difference of 0.010%), Immigrants from Lithuania (48.8%, a difference of 0.020%), Czechoslovakian (48.8%, a difference of 0.050%), and Irish (48.9%, a difference of 0.080%).
DemographicsRating | RankCurrently Married
Welsh
99.5
/100
|
#28
Exceptional
48.9%
Croatians
99.5
/100
|
#29
Exceptional
48.9%
Eastern Europeans
99.5
/100
|
#30
Exceptional
48.9%
Poles
99.5
/100
|
#31
Exceptional
48.9%
Immigrants | Hong Kong
99.5
/100
|
#32
Exceptional
48.9%
Irish
99.5
/100
|
#33
Exceptional
48.9%
Immigrants | Lithuania
99.4
/100
|
#34
Exceptional
48.8%
Immigrants | Northern Europe
99.4
/100
|
#35
Exceptional
48.8%
Italians
99.4
/100
|
#36
Exceptional
48.8%
Hungarians
99.4
/100
|
#37
Exceptional
48.8%
Czechoslovakians
99.4
/100
|
#38
Exceptional
48.8%
British
99.4
/100
|
#39
Exceptional
48.8%
Immigrants | Canada
99.4
/100
|
#40
Exceptional
48.8%
Greeks
99.3
/100
|
#41
Exceptional
48.8%
Finns
99.3
/100
|
#42
Exceptional
48.8%

Demographics Similar to Immigrants from the Azores by Currently Married

In terms of currently married, the demographic groups most similar to Immigrants from the Azores are Immigrants from Laos (45.0%, a difference of 0.080%), Immigrants from Uganda (45.0%, a difference of 0.13%), French American Indian (45.0%, a difference of 0.13%), Comanche (45.0%, a difference of 0.18%), and Spanish American (45.0%, a difference of 0.18%).
DemographicsRating | RankCurrently Married
German Russians
6.7
/100
|
#215
Tragic
45.5%
Immigrants | Morocco
5.5
/100
|
#216
Tragic
45.4%
Immigrants | Thailand
5.1
/100
|
#217
Tragic
45.4%
Panamanians
4.0
/100
|
#218
Tragic
45.3%
Immigrants | Portugal
3.5
/100
|
#219
Tragic
45.2%
Kenyans
3.1
/100
|
#220
Tragic
45.2%
Mexicans
3.0
/100
|
#221
Tragic
45.2%
Immigrants | Azores
2.5
/100
|
#222
Tragic
45.1%
Immigrants | Laos
2.3
/100
|
#223
Tragic
45.0%
Immigrants | Uganda
2.2
/100
|
#224
Tragic
45.0%
French American Indians
2.2
/100
|
#225
Tragic
45.0%
Comanche
2.1
/100
|
#226
Tragic
45.0%
Spanish Americans
2.1
/100
|
#227
Tragic
45.0%
Immigrants | Uruguay
2.0
/100
|
#228
Tragic
45.0%
Cree
1.7
/100
|
#229
Tragic
44.9%