Peruvian vs Kiowa Female Disability
COMPARE
Peruvian
Kiowa
Female Disability
Female Disability Comparison
Peruvians
Kiowa
11.3%
FEMALE DISABILITY
99.9/ 100
METRIC RATING
54th/ 347
METRIC RANK
15.8%
FEMALE DISABILITY
0.0/ 100
METRIC RATING
344th/ 347
METRIC RANK
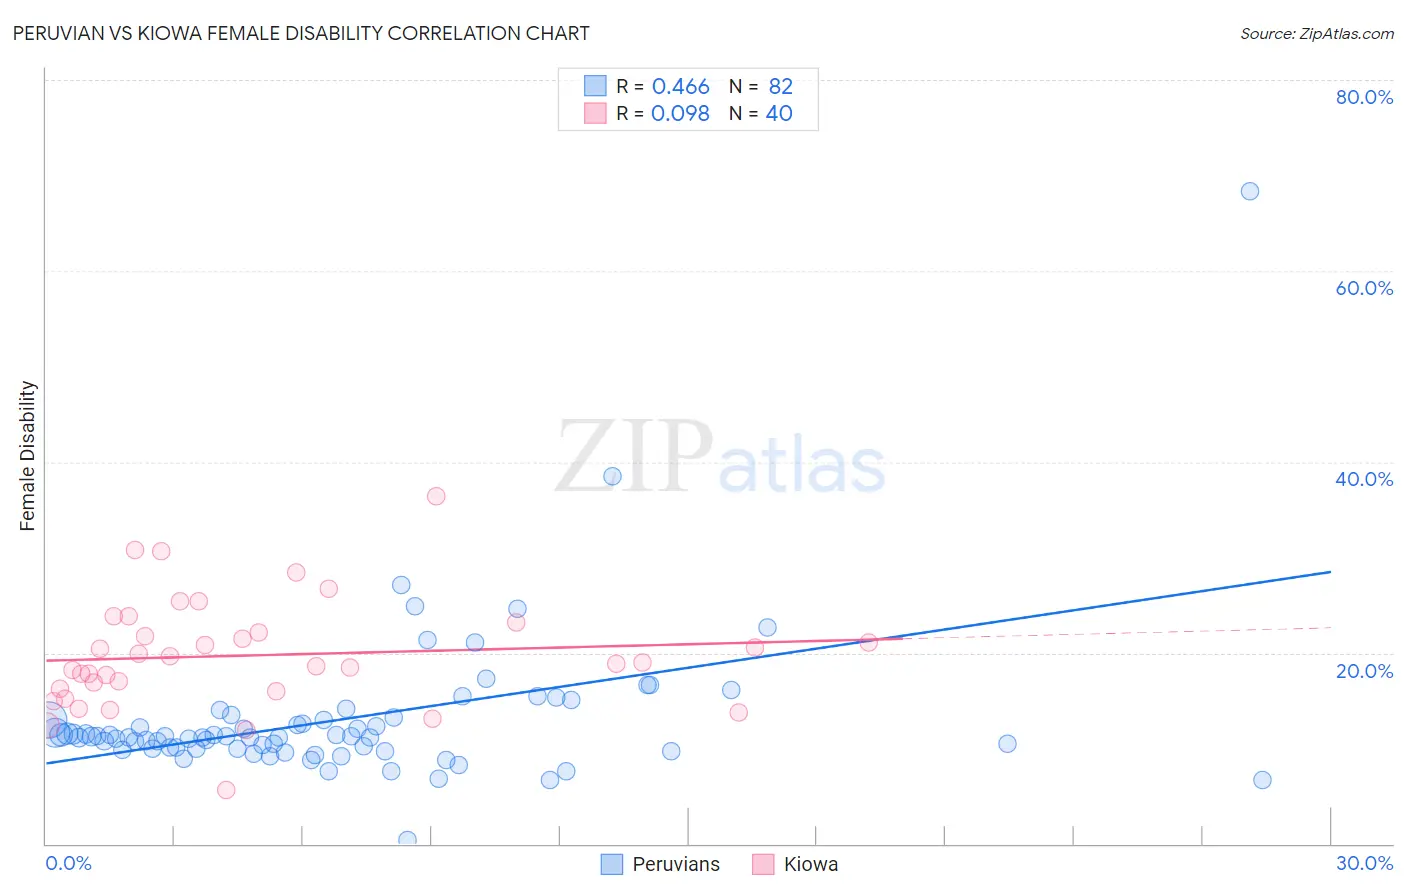
Peruvian vs Kiowa Female Disability Correlation Chart
The statistical analysis conducted on geographies consisting of 363,181,047 people shows a moderate positive correlation between the proportion of Peruvians and percentage of females with a disability in the United States with a correlation coefficient (R) of 0.466 and weighted average of 11.3%. Similarly, the statistical analysis conducted on geographies consisting of 56,098,208 people shows a slight positive correlation between the proportion of Kiowa and percentage of females with a disability in the United States with a correlation coefficient (R) of 0.098 and weighted average of 15.8%, a difference of 39.4%.
Female Disability Correlation Summary
| Measurement | Peruvian | Kiowa |
| Minimum | 0.45% | 5.6% |
| Maximum | 68.3% | 36.4% |
| Range | 67.8% | 30.8% |
| Mean | 13.0% | 19.7% |
| Median | 11.2% | 18.9% |
| Interquartile 25% (IQ1) | 9.9% | 16.1% |
| Interquartile 75% (IQ3) | 13.0% | 22.6% |
| Interquartile Range (IQR) | 3.1% | 6.5% |
| Standard Deviation (Sample) | 8.0% | 5.8% |
| Standard Deviation (Population) | 8.0% | 5.8% |
Similar Demographics by Female Disability
Demographics Similar to Peruvians by Female Disability
In terms of female disability, the demographic groups most similar to Peruvians are Bulgarian (11.3%, a difference of 0.020%), Immigrants from Saudi Arabia (11.3%, a difference of 0.060%), Immigrants from Peru (11.3%, a difference of 0.10%), Immigrants from Belgium (11.3%, a difference of 0.22%), and Taiwanese (11.4%, a difference of 0.25%).
| Demographics | Rating | Rank | Female Disability |
| Jordanians | 100.0 /100 | #47 | Exceptional 11.3% |
| Zimbabweans | 100.0 /100 | #48 | Exceptional 11.3% |
| Tongans | 100.0 /100 | #49 | Exceptional 11.3% |
| Inupiat | 100.0 /100 | #50 | Exceptional 11.3% |
| Immigrants | Belgium | 100.0 /100 | #51 | Exceptional 11.3% |
| Immigrants | Peru | 99.9 /100 | #52 | Exceptional 11.3% |
| Immigrants | Saudi Arabia | 99.9 /100 | #53 | Exceptional 11.3% |
| Peruvians | 99.9 /100 | #54 | Exceptional 11.3% |
| Bulgarians | 99.9 /100 | #55 | Exceptional 11.3% |
| Taiwanese | 99.9 /100 | #56 | Exceptional 11.4% |
| South Americans | 99.9 /100 | #57 | Exceptional 11.4% |
| Laotians | 99.9 /100 | #58 | Exceptional 11.4% |
| Immigrants | Spain | 99.9 /100 | #59 | Exceptional 11.4% |
| Immigrants | Bulgaria | 99.9 /100 | #60 | Exceptional 11.4% |
| Immigrants | France | 99.9 /100 | #61 | Exceptional 11.4% |
Demographics Similar to Kiowa by Female Disability
In terms of female disability, the demographic groups most similar to Kiowa are Lumbee (15.8%, a difference of 0.16%), Creek (15.7%, a difference of 0.84%), Choctaw (15.4%, a difference of 2.5%), Chickasaw (15.2%, a difference of 3.9%), and Colville (15.1%, a difference of 4.8%).
| Demographics | Rating | Rank | Female Disability |
| Immigrants | Azores | 0.0 /100 | #333 | Tragic 14.9% |
| Cherokee | 0.0 /100 | #334 | Tragic 14.9% |
| Cajuns | 0.0 /100 | #335 | Tragic 14.9% |
| Seminole | 0.0 /100 | #336 | Tragic 15.0% |
| Tohono O'odham | 0.0 /100 | #337 | Tragic 15.0% |
| Dutch West Indians | 0.0 /100 | #338 | Tragic 15.0% |
| Colville | 0.0 /100 | #339 | Tragic 15.1% |
| Chickasaw | 0.0 /100 | #340 | Tragic 15.2% |
| Choctaw | 0.0 /100 | #341 | Tragic 15.4% |
| Creek | 0.0 /100 | #342 | Tragic 15.7% |
| Lumbee | 0.0 /100 | #343 | Tragic 15.8% |
| Kiowa | 0.0 /100 | #344 | Tragic 15.8% |
| Puerto Ricans | 0.0 /100 | #345 | Tragic 16.6% |
| Tsimshian | 0.0 /100 | #346 | Tragic 16.8% |
| Houma | 0.0 /100 | #347 | Tragic 16.9% |