New Zealander vs Welsh Female Disability
COMPARE
New Zealander
Welsh
Female Disability
Female Disability Comparison
New Zealanders
Welsh
11.7%
FEMALE DISABILITY
98.1/ 100
METRIC RATING
108th/ 347
METRIC RANK
13.1%
FEMALE DISABILITY
0.0/ 100
METRIC RATING
282nd/ 347
METRIC RANK
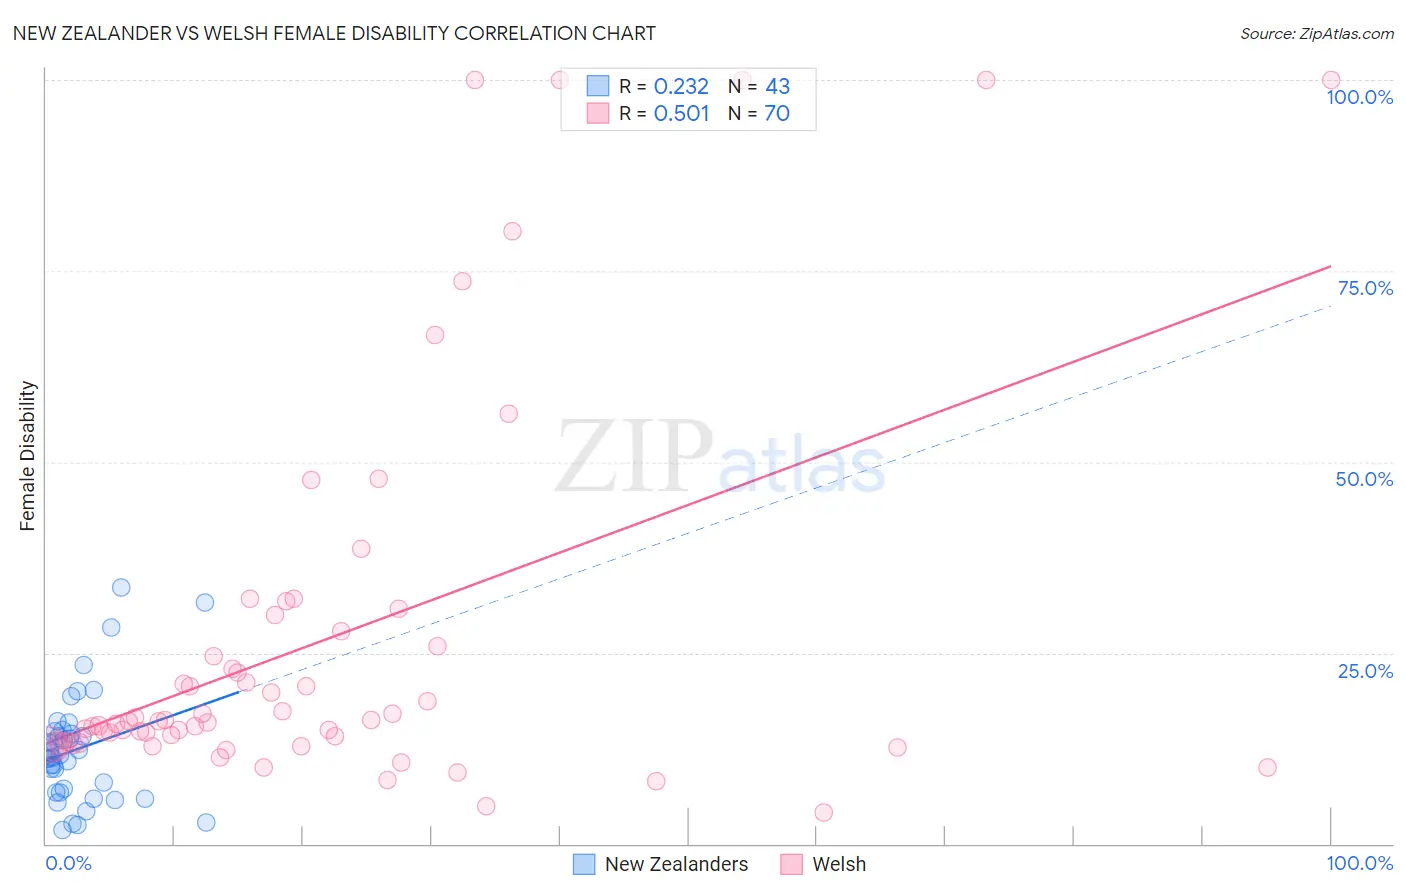
New Zealander vs Welsh Female Disability Correlation Chart
The statistical analysis conducted on geographies consisting of 106,921,285 people shows a weak positive correlation between the proportion of New Zealanders and percentage of females with a disability in the United States with a correlation coefficient (R) of 0.232 and weighted average of 11.7%. Similarly, the statistical analysis conducted on geographies consisting of 528,453,595 people shows a substantial positive correlation between the proportion of Welsh and percentage of females with a disability in the United States with a correlation coefficient (R) of 0.501 and weighted average of 13.1%, a difference of 11.3%.
Female Disability Correlation Summary
| Measurement | New Zealander | Welsh |
| Minimum | 1.9% | 4.2% |
| Maximum | 33.6% | 100.0% |
| Range | 31.7% | 95.8% |
| Mean | 12.4% | 26.8% |
| Median | 11.6% | 16.1% |
| Interquartile 25% (IQ1) | 6.7% | 13.2% |
| Interquartile 75% (IQ3) | 14.7% | 27.8% |
| Interquartile Range (IQR) | 7.9% | 14.7% |
| Standard Deviation (Sample) | 7.2% | 25.2% |
| Standard Deviation (Population) | 7.1% | 25.0% |
Similar Demographics by Female Disability
Demographics Similar to New Zealanders by Female Disability
In terms of female disability, the demographic groups most similar to New Zealanders are Latvian (11.7%, a difference of 0.020%), Immigrants (11.7%, a difference of 0.030%), Soviet Union (11.7%, a difference of 0.030%), Immigrants from Greece (11.7%, a difference of 0.050%), and Costa Rican (11.7%, a difference of 0.050%).
| Demographics | Rating | Rank | Female Disability |
| Immigrants | Costa Rica | 98.4 /100 | #101 | Exceptional 11.7% |
| Immigrants | South Eastern Asia | 98.4 /100 | #102 | Exceptional 11.7% |
| Immigrants | Eastern Africa | 98.3 /100 | #103 | Exceptional 11.7% |
| Immigrants | Western Asia | 98.3 /100 | #104 | Exceptional 11.7% |
| Australians | 98.3 /100 | #105 | Exceptional 11.7% |
| Immigrants | Greece | 98.2 /100 | #106 | Exceptional 11.7% |
| Latvians | 98.2 /100 | #107 | Exceptional 11.7% |
| New Zealanders | 98.1 /100 | #108 | Exceptional 11.7% |
| Immigrants | Immigrants | 98.1 /100 | #109 | Exceptional 11.7% |
| Soviet Union | 98.1 /100 | #110 | Exceptional 11.7% |
| Costa Ricans | 98.1 /100 | #111 | Exceptional 11.7% |
| Immigrants | Bangladesh | 97.8 /100 | #112 | Exceptional 11.8% |
| Immigrants | Belarus | 97.8 /100 | #113 | Exceptional 11.8% |
| South Africans | 97.7 /100 | #114 | Exceptional 11.8% |
| Brazilians | 97.7 /100 | #115 | Exceptional 11.8% |
Demographics Similar to Welsh by Female Disability
In terms of female disability, the demographic groups most similar to Welsh are English (13.1%, a difference of 0.0%), U.S. Virgin Islander (13.1%, a difference of 0.080%), Irish (13.1%, a difference of 0.11%), Hmong (13.1%, a difference of 0.14%), and Bangladeshi (13.1%, a difference of 0.19%).
| Demographics | Rating | Rank | Female Disability |
| Cheyenne | 0.1 /100 | #275 | Tragic 13.0% |
| Immigrants | Dominica | 0.1 /100 | #276 | Tragic 13.0% |
| Spanish | 0.1 /100 | #277 | Tragic 13.0% |
| Scottish | 0.1 /100 | #278 | Tragic 13.0% |
| Arapaho | 0.1 /100 | #279 | Tragic 13.0% |
| Irish | 0.1 /100 | #280 | Tragic 13.1% |
| U.S. Virgin Islanders | 0.1 /100 | #281 | Tragic 13.1% |
| Welsh | 0.0 /100 | #282 | Tragic 13.1% |
| English | 0.0 /100 | #283 | Tragic 13.1% |
| Hmong | 0.0 /100 | #284 | Tragic 13.1% |
| Bangladeshis | 0.0 /100 | #285 | Tragic 13.1% |
| Fijians | 0.0 /100 | #286 | Tragic 13.1% |
| Yaqui | 0.0 /100 | #287 | Tragic 13.2% |
| Whites/Caucasians | 0.0 /100 | #288 | Tragic 13.2% |
| Tlingit-Haida | 0.0 /100 | #289 | Tragic 13.2% |