Immigrants from Russia vs Japanese Disability
COMPARE
Immigrants from Russia
Japanese
Disability
Disability Comparison
Immigrants from Russia
Japanese
11.1%
DISABILITY
98.9/ 100
METRIC RATING
86th/ 347
METRIC RANK
12.2%
DISABILITY
2.3/ 100
METRIC RATING
234th/ 347
METRIC RANK
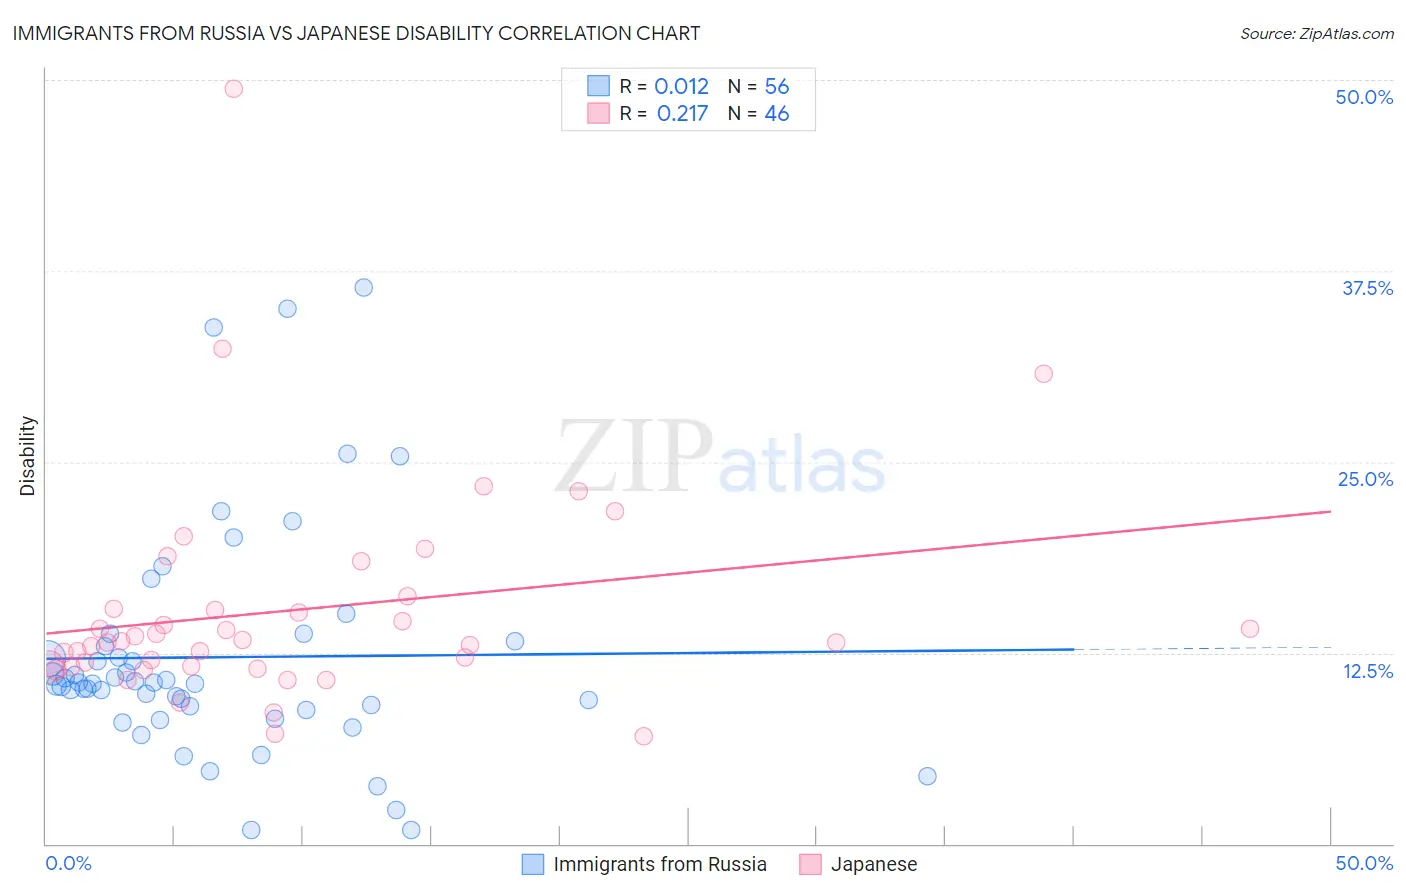
Immigrants from Russia vs Japanese Disability Correlation Chart
The statistical analysis conducted on geographies consisting of 347,926,154 people shows no correlation between the proportion of Immigrants from Russia and percentage of population with a disability in the United States with a correlation coefficient (R) of 0.012 and weighted average of 11.1%. Similarly, the statistical analysis conducted on geographies consisting of 249,165,535 people shows a weak positive correlation between the proportion of Japanese and percentage of population with a disability in the United States with a correlation coefficient (R) of 0.217 and weighted average of 12.2%, a difference of 9.6%.
Disability Correlation Summary
| Measurement | Immigrants from Russia | Japanese |
| Minimum | 0.87% | 7.1% |
| Maximum | 36.4% | 49.5% |
| Range | 35.5% | 42.4% |
| Mean | 12.2% | 15.3% |
| Median | 10.5% | 13.2% |
| Interquartile 25% (IQ1) | 8.9% | 11.6% |
| Interquartile 75% (IQ3) | 13.1% | 15.3% |
| Interquartile Range (IQR) | 4.2% | 3.8% |
| Standard Deviation (Sample) | 7.5% | 7.3% |
| Standard Deviation (Population) | 7.4% | 7.2% |
Similar Demographics by Disability
Demographics Similar to Immigrants from Russia by Disability
In terms of disability, the demographic groups most similar to Immigrants from Russia are Immigrants from Belarus (11.1%, a difference of 0.0%), Palestinian (11.1%, a difference of 0.040%), Immigrants from Sierra Leone (11.1%, a difference of 0.15%), Immigrants from Switzerland (11.1%, a difference of 0.17%), and Chilean (11.1%, a difference of 0.20%).
| Demographics | Rating | Rank | Disability |
| Immigrants | Jordan | 99.3 /100 | #79 | Exceptional 11.1% |
| Immigrants | Ireland | 99.3 /100 | #80 | Exceptional 11.1% |
| Immigrants | Poland | 99.1 /100 | #81 | Exceptional 11.1% |
| Chileans | 99.1 /100 | #82 | Exceptional 11.1% |
| Immigrants | Switzerland | 99.0 /100 | #83 | Exceptional 11.1% |
| Immigrants | Sierra Leone | 99.0 /100 | #84 | Exceptional 11.1% |
| Immigrants | Belarus | 98.9 /100 | #85 | Exceptional 11.1% |
| Immigrants | Russia | 98.9 /100 | #86 | Exceptional 11.1% |
| Palestinians | 98.9 /100 | #87 | Exceptional 11.1% |
| Immigrants | Romania | 98.5 /100 | #88 | Exceptional 11.2% |
| Immigrants | South Africa | 98.2 /100 | #89 | Exceptional 11.2% |
| Immigrants | Brazil | 98.1 /100 | #90 | Exceptional 11.2% |
| Immigrants | Western Asia | 98.1 /100 | #91 | Exceptional 11.2% |
| Ecuadorians | 98.0 /100 | #92 | Exceptional 11.2% |
| Immigrants | Ecuador | 98.0 /100 | #93 | Exceptional 11.2% |
Demographics Similar to Japanese by Disability
In terms of disability, the demographic groups most similar to Japanese are Bahamian (12.2%, a difference of 0.030%), Yup'ik (12.2%, a difference of 0.040%), Italian (12.2%, a difference of 0.12%), Malaysian (12.2%, a difference of 0.13%), and Chinese (12.2%, a difference of 0.13%).
| Demographics | Rating | Rank | Disability |
| Alsatians | 3.3 /100 | #227 | Tragic 12.1% |
| West Indians | 2.9 /100 | #228 | Tragic 12.2% |
| Inupiat | 2.8 /100 | #229 | Tragic 12.2% |
| Samoans | 2.6 /100 | #230 | Tragic 12.2% |
| Malaysians | 2.5 /100 | #231 | Tragic 12.2% |
| Italians | 2.5 /100 | #232 | Tragic 12.2% |
| Bahamians | 2.3 /100 | #233 | Tragic 12.2% |
| Japanese | 2.3 /100 | #234 | Tragic 12.2% |
| Yup'ik | 2.2 /100 | #235 | Tragic 12.2% |
| Chinese | 2.0 /100 | #236 | Tragic 12.2% |
| Immigrants | Congo | 1.9 /100 | #237 | Tragic 12.2% |
| Norwegians | 1.9 /100 | #238 | Tragic 12.2% |
| Swedes | 1.8 /100 | #239 | Tragic 12.2% |
| Hungarians | 1.7 /100 | #240 | Tragic 12.2% |
| Yugoslavians | 1.7 /100 | #241 | Tragic 12.2% |