Fijian vs Japanese Disability
COMPARE
Fijian
Japanese
Disability
Disability Comparison
Fijians
Japanese
12.8%
DISABILITY
0.0/ 100
METRIC RATING
279th/ 347
METRIC RANK
12.2%
DISABILITY
2.3/ 100
METRIC RATING
234th/ 347
METRIC RANK
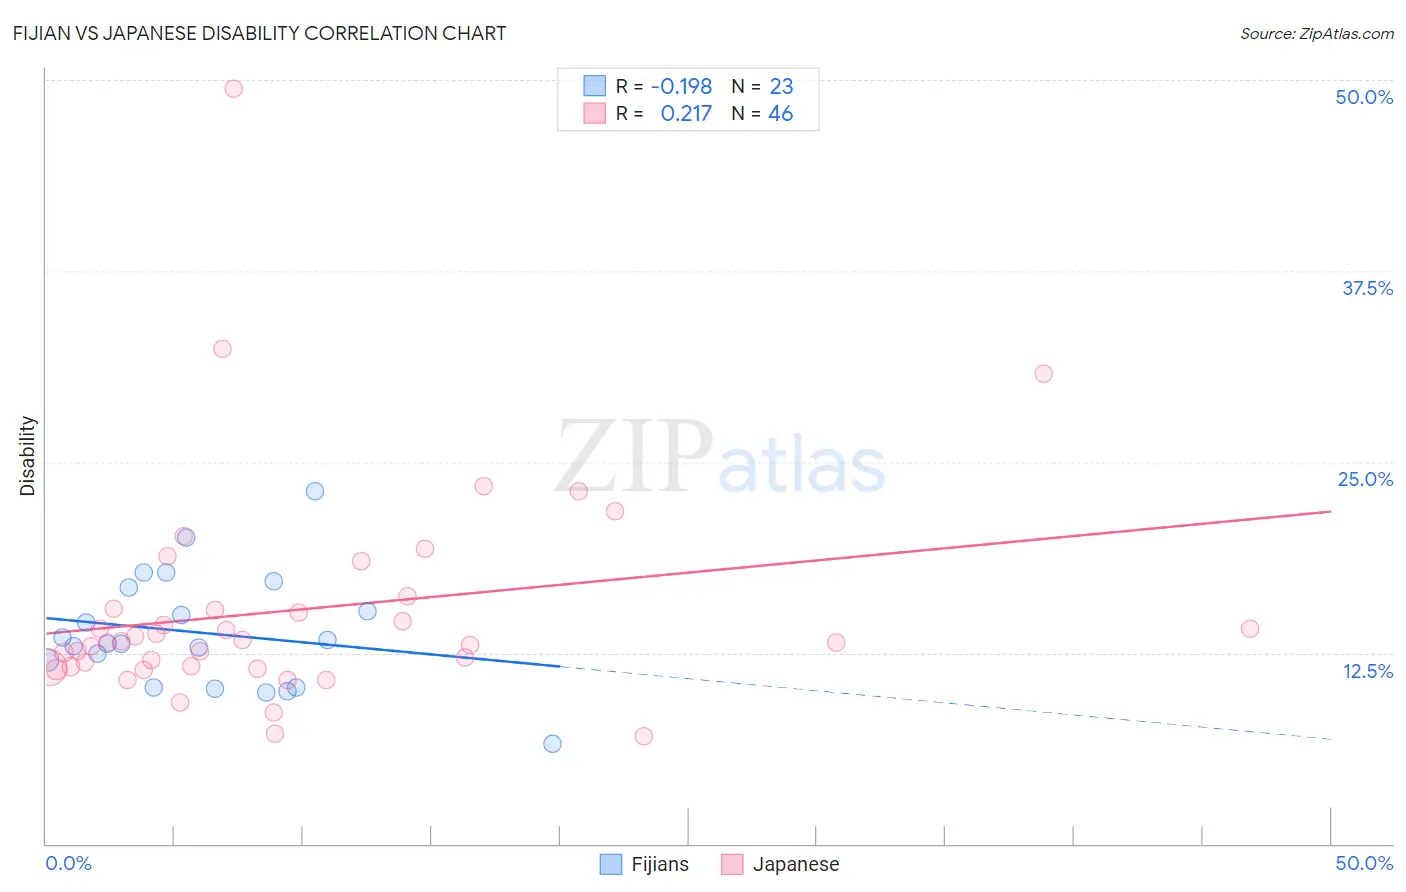
Fijian vs Japanese Disability Correlation Chart
The statistical analysis conducted on geographies consisting of 55,947,896 people shows a poor negative correlation between the proportion of Fijians and percentage of population with a disability in the United States with a correlation coefficient (R) of -0.198 and weighted average of 12.8%. Similarly, the statistical analysis conducted on geographies consisting of 249,165,535 people shows a weak positive correlation between the proportion of Japanese and percentage of population with a disability in the United States with a correlation coefficient (R) of 0.217 and weighted average of 12.2%, a difference of 5.3%.
Disability Correlation Summary
| Measurement | Fijian | Japanese |
| Minimum | 6.6% | 7.1% |
| Maximum | 23.1% | 49.5% |
| Range | 16.5% | 42.4% |
| Mean | 13.8% | 15.3% |
| Median | 13.1% | 13.2% |
| Interquartile 25% (IQ1) | 10.2% | 11.6% |
| Interquartile 75% (IQ3) | 16.8% | 15.3% |
| Interquartile Range (IQR) | 6.5% | 3.8% |
| Standard Deviation (Sample) | 3.7% | 7.3% |
| Standard Deviation (Population) | 3.7% | 7.2% |
Similar Demographics by Disability
Demographics Similar to Fijians by Disability
In terms of disability, the demographic groups most similar to Fijians are Spanish (12.8%, a difference of 0.050%), German (12.8%, a difference of 0.090%), Immigrants from Portugal (12.9%, a difference of 0.19%), Dutch (12.8%, a difference of 0.26%), and Hmong (12.8%, a difference of 0.31%).
| Demographics | Rating | Rank | Disability |
| Dominicans | 0.0 /100 | #272 | Tragic 12.7% |
| Finns | 0.0 /100 | #273 | Tragic 12.7% |
| Nepalese | 0.0 /100 | #274 | Tragic 12.8% |
| Sioux | 0.0 /100 | #275 | Tragic 12.8% |
| Hmong | 0.0 /100 | #276 | Tragic 12.8% |
| Dutch | 0.0 /100 | #277 | Tragic 12.8% |
| Germans | 0.0 /100 | #278 | Tragic 12.8% |
| Fijians | 0.0 /100 | #279 | Tragic 12.8% |
| Spanish | 0.0 /100 | #280 | Tragic 12.8% |
| Immigrants | Portugal | 0.0 /100 | #281 | Tragic 12.9% |
| Scottish | 0.0 /100 | #282 | Tragic 12.9% |
| Irish | 0.0 /100 | #283 | Tragic 12.9% |
| Welsh | 0.0 /100 | #284 | Tragic 12.9% |
| Crow | 0.0 /100 | #285 | Tragic 12.9% |
| English | 0.0 /100 | #286 | Tragic 13.0% |
Demographics Similar to Japanese by Disability
In terms of disability, the demographic groups most similar to Japanese are Bahamian (12.2%, a difference of 0.030%), Yup'ik (12.2%, a difference of 0.040%), Italian (12.2%, a difference of 0.12%), Malaysian (12.2%, a difference of 0.13%), and Chinese (12.2%, a difference of 0.13%).
| Demographics | Rating | Rank | Disability |
| Alsatians | 3.3 /100 | #227 | Tragic 12.1% |
| West Indians | 2.9 /100 | #228 | Tragic 12.2% |
| Inupiat | 2.8 /100 | #229 | Tragic 12.2% |
| Samoans | 2.6 /100 | #230 | Tragic 12.2% |
| Malaysians | 2.5 /100 | #231 | Tragic 12.2% |
| Italians | 2.5 /100 | #232 | Tragic 12.2% |
| Bahamians | 2.3 /100 | #233 | Tragic 12.2% |
| Japanese | 2.3 /100 | #234 | Tragic 12.2% |
| Yup'ik | 2.2 /100 | #235 | Tragic 12.2% |
| Chinese | 2.0 /100 | #236 | Tragic 12.2% |
| Immigrants | Congo | 1.9 /100 | #237 | Tragic 12.2% |
| Norwegians | 1.9 /100 | #238 | Tragic 12.2% |
| Swedes | 1.8 /100 | #239 | Tragic 12.2% |
| Hungarians | 1.7 /100 | #240 | Tragic 12.2% |
| Yugoslavians | 1.7 /100 | #241 | Tragic 12.2% |