Dominican vs Immigrants from Ireland Disability
COMPARE
Dominican
Immigrants from Ireland
Disability
Disability Comparison
Dominicans
Immigrants from Ireland
12.7%
DISABILITY
0.0/ 100
METRIC RATING
272nd/ 347
METRIC RANK
11.1%
DISABILITY
99.3/ 100
METRIC RATING
80th/ 347
METRIC RANK
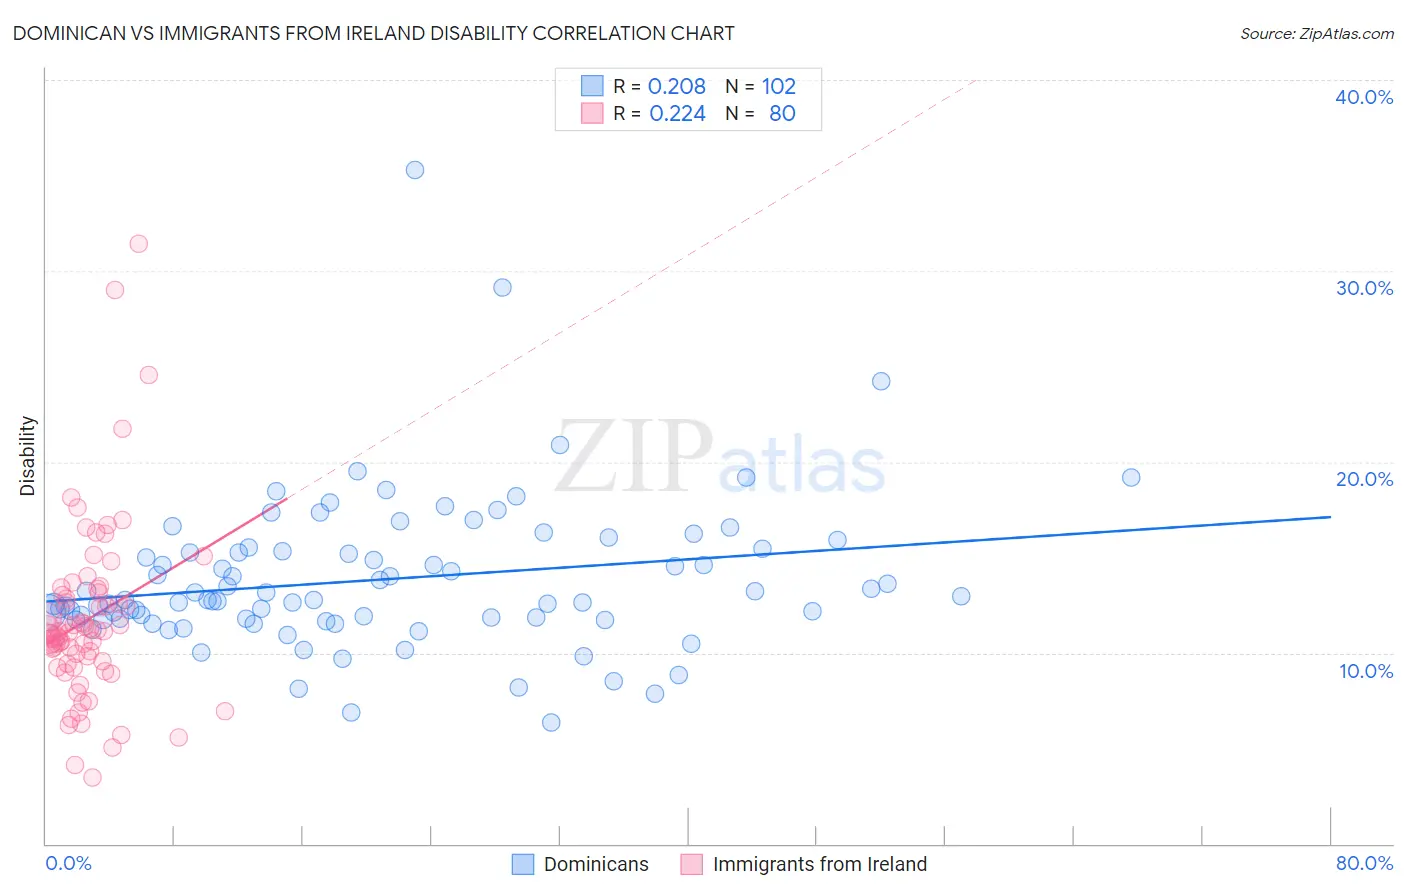
Dominican vs Immigrants from Ireland Disability Correlation Chart
The statistical analysis conducted on geographies consisting of 355,062,868 people shows a weak positive correlation between the proportion of Dominicans and percentage of population with a disability in the United States with a correlation coefficient (R) of 0.208 and weighted average of 12.7%. Similarly, the statistical analysis conducted on geographies consisting of 240,775,613 people shows a weak positive correlation between the proportion of Immigrants from Ireland and percentage of population with a disability in the United States with a correlation coefficient (R) of 0.224 and weighted average of 11.1%, a difference of 14.7%.
Disability Correlation Summary
| Measurement | Dominican | Immigrants from Ireland |
| Minimum | 6.4% | 3.4% |
| Maximum | 35.3% | 31.4% |
| Range | 28.9% | 28.0% |
| Mean | 13.8% | 11.7% |
| Median | 12.8% | 11.0% |
| Interquartile 25% (IQ1) | 11.8% | 9.5% |
| Interquartile 75% (IQ3) | 15.3% | 13.1% |
| Interquartile Range (IQR) | 3.5% | 3.6% |
| Standard Deviation (Sample) | 4.0% | 4.7% |
| Standard Deviation (Population) | 4.0% | 4.6% |
Similar Demographics by Disability
Demographics Similar to Dominicans by Disability
In terms of disability, the demographic groups most similar to Dominicans are Finnish (12.7%, a difference of 0.16%), Immigrants from Yemen (12.6%, a difference of 0.49%), Portuguese (12.6%, a difference of 0.54%), Nepalese (12.8%, a difference of 0.60%), and Sioux (12.8%, a difference of 0.68%).
| Demographics | Rating | Rank | Disability |
| U.S. Virgin Islanders | 0.2 /100 | #265 | Tragic 12.5% |
| Czechoslovakians | 0.2 /100 | #266 | Tragic 12.5% |
| Spaniards | 0.2 /100 | #267 | Tragic 12.5% |
| Bangladeshis | 0.1 /100 | #268 | Tragic 12.6% |
| Immigrants | Dominican Republic | 0.1 /100 | #269 | Tragic 12.6% |
| Portuguese | 0.1 /100 | #270 | Tragic 12.6% |
| Immigrants | Yemen | 0.1 /100 | #271 | Tragic 12.6% |
| Dominicans | 0.0 /100 | #272 | Tragic 12.7% |
| Finns | 0.0 /100 | #273 | Tragic 12.7% |
| Nepalese | 0.0 /100 | #274 | Tragic 12.8% |
| Sioux | 0.0 /100 | #275 | Tragic 12.8% |
| Hmong | 0.0 /100 | #276 | Tragic 12.8% |
| Dutch | 0.0 /100 | #277 | Tragic 12.8% |
| Germans | 0.0 /100 | #278 | Tragic 12.8% |
| Fijians | 0.0 /100 | #279 | Tragic 12.8% |
Demographics Similar to Immigrants from Ireland by Disability
In terms of disability, the demographic groups most similar to Immigrants from Ireland are Immigrants from Jordan (11.1%, a difference of 0.050%), Immigrants from Cameroon (11.1%, a difference of 0.080%), Sierra Leonean (11.0%, a difference of 0.12%), Immigrants from Belgium (11.0%, a difference of 0.12%), and Immigrants from Vietnam (11.0%, a difference of 0.15%).
| Demographics | Rating | Rank | Disability |
| Immigrants | Bangladesh | 99.4 /100 | #73 | Exceptional 11.0% |
| Immigrants | Serbia | 99.4 /100 | #74 | Exceptional 11.0% |
| Immigrants | Vietnam | 99.4 /100 | #75 | Exceptional 11.0% |
| Sierra Leoneans | 99.3 /100 | #76 | Exceptional 11.0% |
| Immigrants | Belgium | 99.3 /100 | #77 | Exceptional 11.0% |
| Immigrants | Cameroon | 99.3 /100 | #78 | Exceptional 11.1% |
| Immigrants | Jordan | 99.3 /100 | #79 | Exceptional 11.1% |
| Immigrants | Ireland | 99.3 /100 | #80 | Exceptional 11.1% |
| Immigrants | Poland | 99.1 /100 | #81 | Exceptional 11.1% |
| Chileans | 99.1 /100 | #82 | Exceptional 11.1% |
| Immigrants | Switzerland | 99.0 /100 | #83 | Exceptional 11.1% |
| Immigrants | Sierra Leone | 99.0 /100 | #84 | Exceptional 11.1% |
| Immigrants | Belarus | 98.9 /100 | #85 | Exceptional 11.1% |
| Immigrants | Russia | 98.9 /100 | #86 | Exceptional 11.1% |
| Palestinians | 98.9 /100 | #87 | Exceptional 11.1% |