Yuman vs Immigrants from Ireland 7th Grade

COMPARE

Yuman
Race
Ancestry
AfghanAfricanAlaska NativeAlaskan AthabascanAlbanianAleutAlsatianAmericanApacheArabArapahoArgentineanArmenianAssyrian/Chaldean/SyriacAustralianAustrianBahamianBangladeshiBarbadianBasqueBelgianBelizeanBermudanBhutaneseBlackfeetBolivianBrazilianBritishBritish West IndianBulgarianBurmeseCajunCambodianCanadianCape VerdeanCarpatho RusynCelticCentral AmericanCentral American IndianCherokeeCheyenneChickasawChileanChineseChippewaChoctawColombianColvilleComancheCosta RicanCreeCreekCroatianCrowCubanCypriotCzechCzechoslovakianDanishDelawareDominicanDutchDutch West IndianEastern EuropeanEcuadorianEgyptianEnglishEstonianEthiopianEuropeanFijianFilipinoFinnishFrenchFrench American IndianFrench CanadianGermanGerman RussianGhanaianGreekGuamanian/ChamorroGuatemalanGuyaneseHaitianHmongHonduranHopiHoumaHungarianIcelanderIndian (Asian)IndonesianInupiatIranianIraqiIrishIroquoisIsraeliItalianJamaicanJapaneseJordanianKenyanKiowaKoreanLaotianLatvianLebaneseLiberianLithuanianLumbeeLuxembourgerMacedonianMalaysianMalteseMarshalleseMenomineeMexicanMexican American IndianMongolianMoroccanNative HawaiianNavajoNepaleseNew ZealanderNicaraguanNigerianNorthern EuropeanNorwegianOkinawanOsageOttawaPaiutePakistaniPalestinianPanamanianParaguayanPennsylvania GermanPeruvianPimaPolishPortuguesePotawatomiPuebloPuerto RicanPuget Sound SalishRomanianRussianSalvadoranSamoanScandinavianScotch-IrishScottishSeminoleSenegaleseSerbianShoshoneSierra LeoneanSiouxSlavicSlovakSloveneSomaliSouth AfricanSouth AmericanSouth American IndianSoviet UnionSpaniardSpanishSpanish AmericanSpanish American IndianSri LankanSubsaharan AfricanSudaneseSwedishSwissSyrianTaiwaneseThaiTlingit-HaidaTohono O'OdhamTonganTrinidadian and TobagonianTsimshianTurkishU.S. Virgin IslanderUgandanUkrainianUruguayanUteVenezuelanVietnameseWelshWest IndianYakamaYaquiYugoslavianYumanYup'ikZimbabwean
Immigration
NonimmigrantsImmigrantsAfghanistanAfricaAlbaniaArgentinaArmeniaAsiaAustraliaAustriaBahamasBangladeshBarbadosBelarusBelgiumBelizeBoliviaBosnia and HerzegovinaBrazilBulgariaBurma/MyanmarCabo VerdeCambodiaCameroonCanadaCaribbeanCentral AmericaChileChinaColombiaCongoCosta RicaCroatiaCubaCzechoslovakiaDenmarkDominicaDominican RepublicEastern AfricaEastern AsiaEastern EuropeEcuadorEgyptEl SalvadorEnglandEritreaEthiopiaEuropeFijiFranceGermanyGhanaGreeceGrenadaGuatemalaGuyanaHaitiHondurasHong KongHungaryIndiaIndonesiaIranIraqIsraelItalyJamaicaJapanJordanKazakhstanKenyaKoreaKuwaitLaosLatin AmericaLatviaLebanonLiberiaLithuaniaMalaysiaMexicoMicronesiaMiddle AfricaMoldovaMoroccoNepalNetherlandsNicaraguaNigeriaNorth AmericaNorth MacedoniaNorthern AfricaNorthern EuropeNorwayOceaniaPakistanPanamaPeruPhilippinesPolandPortugalRomaniaRussiaSaudi ArabiaScotlandSenegalSerbiaSierra LeoneSingaporeSomaliaSouth AfricaSouth AmericaSouth Central AsiaSouth Eastern AsiaSouthern EuropeSpainSri LankaSt. Vincent and the GrenadinesSudanSwedenSwitzerlandSyriaTaiwanThailandTrinidad and TobagoTurkeyUgandaUkraineUruguayUzbekistanVenezuelaVietnamWest IndiesWestern AfricaWestern AsiaWestern EuropeYemenZaireZimbabweAzores
Immigrants from Ireland
Race
Ancestry
AfghanAfricanAlaska NativeAlaskan AthabascanAlbanianAleutAlsatianAmericanApacheArabArapahoArgentineanArmenianAssyrian/Chaldean/SyriacAustralianAustrianBahamianBangladeshiBarbadianBasqueBelgianBelizeanBermudanBhutaneseBlackfeetBolivianBrazilianBritishBritish West IndianBulgarianBurmeseCajunCambodianCanadianCape VerdeanCarpatho RusynCelticCentral AmericanCentral American IndianCherokeeCheyenneChickasawChileanChineseChippewaChoctawColombianColvilleComancheCosta RicanCreeCreekCroatianCrowCubanCypriotCzechCzechoslovakianDanishDelawareDominicanDutchDutch West IndianEastern EuropeanEcuadorianEgyptianEnglishEstonianEthiopianEuropeanFijianFilipinoFinnishFrenchFrench American IndianFrench CanadianGermanGerman RussianGhanaianGreekGuamanian/ChamorroGuatemalanGuyaneseHaitianHmongHonduranHopiHoumaHungarianIcelanderIndian (Asian)IndonesianInupiatIranianIraqiIrishIroquoisIsraeliItalianJamaicanJapaneseJordanianKenyanKiowaKoreanLaotianLatvianLebaneseLiberianLithuanianLumbeeLuxembourgerMacedonianMalaysianMalteseMarshalleseMenomineeMexicanMexican American IndianMongolianMoroccanNative HawaiianNavajoNepaleseNew ZealanderNicaraguanNigerianNorthern EuropeanNorwegianOkinawanOsageOttawaPaiutePakistaniPalestinianPanamanianParaguayanPennsylvania GermanPeruvianPimaPolishPortuguesePotawatomiPuebloPuerto RicanPuget Sound SalishRomanianRussianSalvadoranSamoanScandinavianScotch-IrishScottishSeminoleSenegaleseSerbianShoshoneSierra LeoneanSiouxSlavicSlovakSloveneSomaliSouth AfricanSouth AmericanSouth American IndianSoviet UnionSpaniardSpanishSpanish AmericanSpanish American IndianSri LankanSubsaharan AfricanSudaneseSwedishSwissSyrianTaiwaneseThaiTlingit-HaidaTohono O'OdhamTonganTrinidadian and TobagonianTsimshianTurkishU.S. Virgin IslanderUgandanUkrainianUruguayanUteVenezuelanVietnameseWelshWest IndianYakamaYaquiYugoslavianYup'ikZimbabwean
Immigration
NonimmigrantsImmigrantsAfghanistanAfricaAlbaniaArgentinaArmeniaAsiaAustraliaAustriaBahamasBangladeshBarbadosBelarusBelgiumBelizeBoliviaBosnia and HerzegovinaBrazilBulgariaBurma/MyanmarCabo VerdeCambodiaCameroonCanadaCaribbeanCentral AmericaChileChinaColombiaCongoCosta RicaCroatiaCubaCzechoslovakiaDenmarkDominicaDominican RepublicEastern AfricaEastern AsiaEastern EuropeEcuadorEgyptEl SalvadorEnglandEritreaEthiopiaEuropeFijiFranceGermanyGhanaGreeceGrenadaGuatemalaGuyanaHaitiHondurasHong KongHungaryIndiaIndonesiaIranIraqIrelandIsraelItalyJamaicaJapanJordanKazakhstanKenyaKoreaKuwaitLaosLatin AmericaLatviaLebanonLiberiaLithuaniaMalaysiaMexicoMicronesiaMiddle AfricaMoldovaMoroccoNepalNetherlandsNicaraguaNigeriaNorth AmericaNorth MacedoniaNorthern AfricaNorthern EuropeNorwayOceaniaPakistanPanamaPeruPhilippinesPolandPortugalRomaniaRussiaSaudi ArabiaScotlandSenegalSerbiaSierra LeoneSingaporeSomaliaSouth AfricaSouth AmericaSouth Central AsiaSouth Eastern AsiaSouthern EuropeSpainSri LankaSt. Vincent and the GrenadinesSudanSwedenSwitzerlandSyriaTaiwanThailandTrinidad and TobagoTurkeyUgandaUkraineUruguayUzbekistanVenezuelaVietnamWest IndiesWestern AfricaWestern AsiaWestern EuropeYemenZaireZimbabweAzores
7th Grade
Income
Poverty
Unemployment
Labor Participation
Family Structure
Vehicle Availability
Education Level
Disability

7th Grade Comparison

Yuman

Immigrants from Ireland

Tragic
Exceptional
95.2%
7TH GRADE
0.3/ 100
METRIC RATING
267th/ 347
METRIC RANK
96.8%
7TH GRADE
99.4/ 100
METRIC RATING
76th/ 347
METRIC RANK

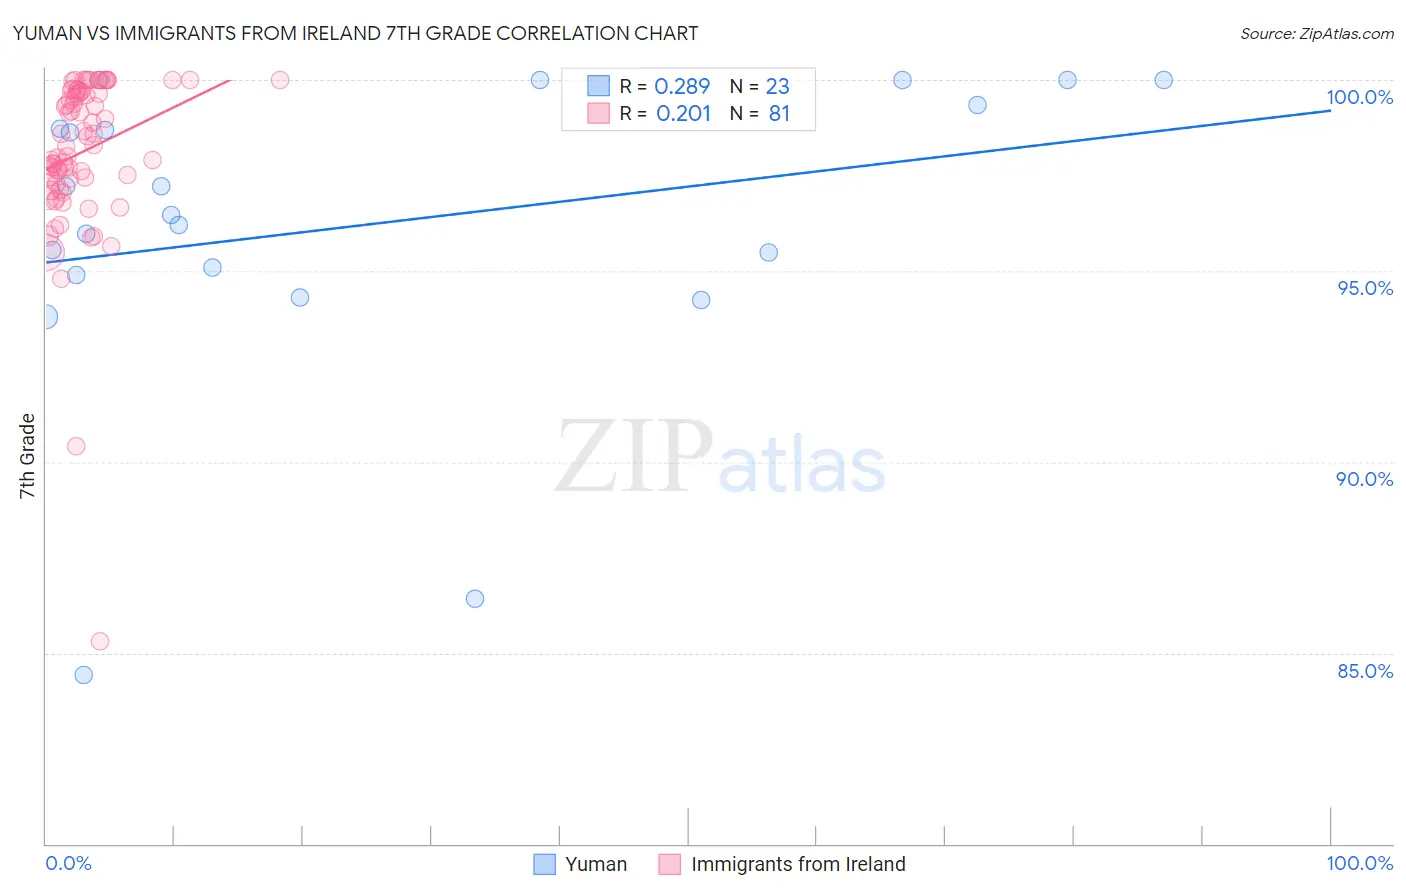
Yuman vs Immigrants from Ireland 7th Grade Correlation Chart

The statistical analysis conducted on geographies consisting of 40,696,349 people shows a weak positive correlation between the proportion of Yuman and percentage of population with at least 7th grade education in the United States with a correlation coefficient (R) of 0.289 and weighted average of 95.2%. Similarly, the statistical analysis conducted on geographies consisting of 240,784,498 people shows a weak positive correlation between the proportion of Immigrants from Ireland and percentage of population with at least 7th grade education in the United States with a correlation coefficient (R) of 0.201 and weighted average of 96.8%, a difference of 1.7%.
Yuman vs Immigrants from Ireland 7th Grade

7th Grade Correlation Summary

MeasurementYumanImmigrants from Ireland
Minimum84.4%85.3%
Maximum100.0%100.0%
Range15.6%14.7%
Mean96.2%98.1%
Median96.5%98.3%
Interquartile 25% (IQ1)94.9%97.4%
Interquartile 75% (IQ3)99.3%99.7%
Interquartile Range (IQR)4.4%2.3%
Standard Deviation (Sample)4.0%2.2%
Standard Deviation (Population)3.9%2.2%

Similar Demographics by 7th Grade

Demographics Similar to Yuman by 7th Grade

In terms of 7th grade, the demographic groups most similar to Yuman are Immigrants from Ghana (95.2%, a difference of 0.010%), Immigrants from Hong Kong (95.2%, a difference of 0.010%), Immigrants from Uruguay (95.2%, a difference of 0.020%), Trinidadian and Tobagonian (95.2%, a difference of 0.030%), and Immigrants from Nigeria (95.2%, a difference of 0.050%).
DemographicsRating | Rank7th Grade
Afghans
0.5
/100
|
#260
Tragic
95.3%
South Americans
0.5
/100
|
#261
Tragic
95.2%
Immigrants | Somalia
0.5
/100
|
#262
Tragic
95.2%
West Indians
0.5
/100
|
#263
Tragic
95.2%
Immigrants | Nigeria
0.4
/100
|
#264
Tragic
95.2%
Immigrants | Uruguay
0.3
/100
|
#265
Tragic
95.2%
Immigrants | Ghana
0.3
/100
|
#266
Tragic
95.2%
Yuman
0.3
/100
|
#267
Tragic
95.2%
Immigrants | Hong Kong
0.3
/100
|
#268
Tragic
95.2%
Trinidadians and Tobagonians
0.3
/100
|
#269
Tragic
95.2%
Houma
0.2
/100
|
#270
Tragic
95.1%
Immigrants | South America
0.2
/100
|
#271
Tragic
95.1%
Peruvians
0.2
/100
|
#272
Tragic
95.1%
Immigrants | Uzbekistan
0.2
/100
|
#273
Tragic
95.1%
Immigrants | Western Africa
0.2
/100
|
#274
Tragic
95.1%

Demographics Similar to Immigrants from Ireland by 7th Grade

In terms of 7th grade, the demographic groups most similar to Immigrants from Ireland are Cherokee (96.8%, a difference of 0.0%), Immigrants from Netherlands (96.8%, a difference of 0.010%), Cypriot (96.8%, a difference of 0.010%), Yugoslavian (96.8%, a difference of 0.010%), and Zimbabwean (96.8%, a difference of 0.020%).
DemographicsRating | Rank7th Grade
Iranians
99.6
/100
|
#69
Exceptional
96.8%
New Zealanders
99.6
/100
|
#70
Exceptional
96.8%
Immigrants | Lithuania
99.6
/100
|
#71
Exceptional
96.8%
Cajuns
99.5
/100
|
#72
Exceptional
96.8%
Arapaho
99.5
/100
|
#73
Exceptional
96.8%
Immigrants | England
99.5
/100
|
#74
Exceptional
96.8%
Zimbabweans
99.5
/100
|
#75
Exceptional
96.8%
Immigrants | Ireland
99.4
/100
|
#76
Exceptional
96.8%
Cherokee
99.4
/100
|
#77
Exceptional
96.8%
Immigrants | Netherlands
99.3
/100
|
#78
Exceptional
96.8%
Cypriots
99.3
/100
|
#79
Exceptional
96.8%
Yugoslavians
99.3
/100
|
#80
Exceptional
96.8%
Delaware
99.2
/100
|
#81
Exceptional
96.8%
Chickasaw
99.2
/100
|
#82
Exceptional
96.7%
Icelanders
99.1
/100
|
#83
Exceptional
96.7%