Yuman vs Immigrants from Ireland College, 1 year or more
COMPARE
Yuman
Immigrants from Ireland
College, 1 year or more
College, 1 year or more Comparison
Yuman
Immigrants from Ireland
48.7%
COLLEGE, 1 YEAR OR MORE
0.0/ 100
METRIC RATING
335th/ 347
METRIC RANK
65.9%
COLLEGE, 1 YEAR OR MORE
100.0/ 100
METRIC RATING
27th/ 347
METRIC RANK
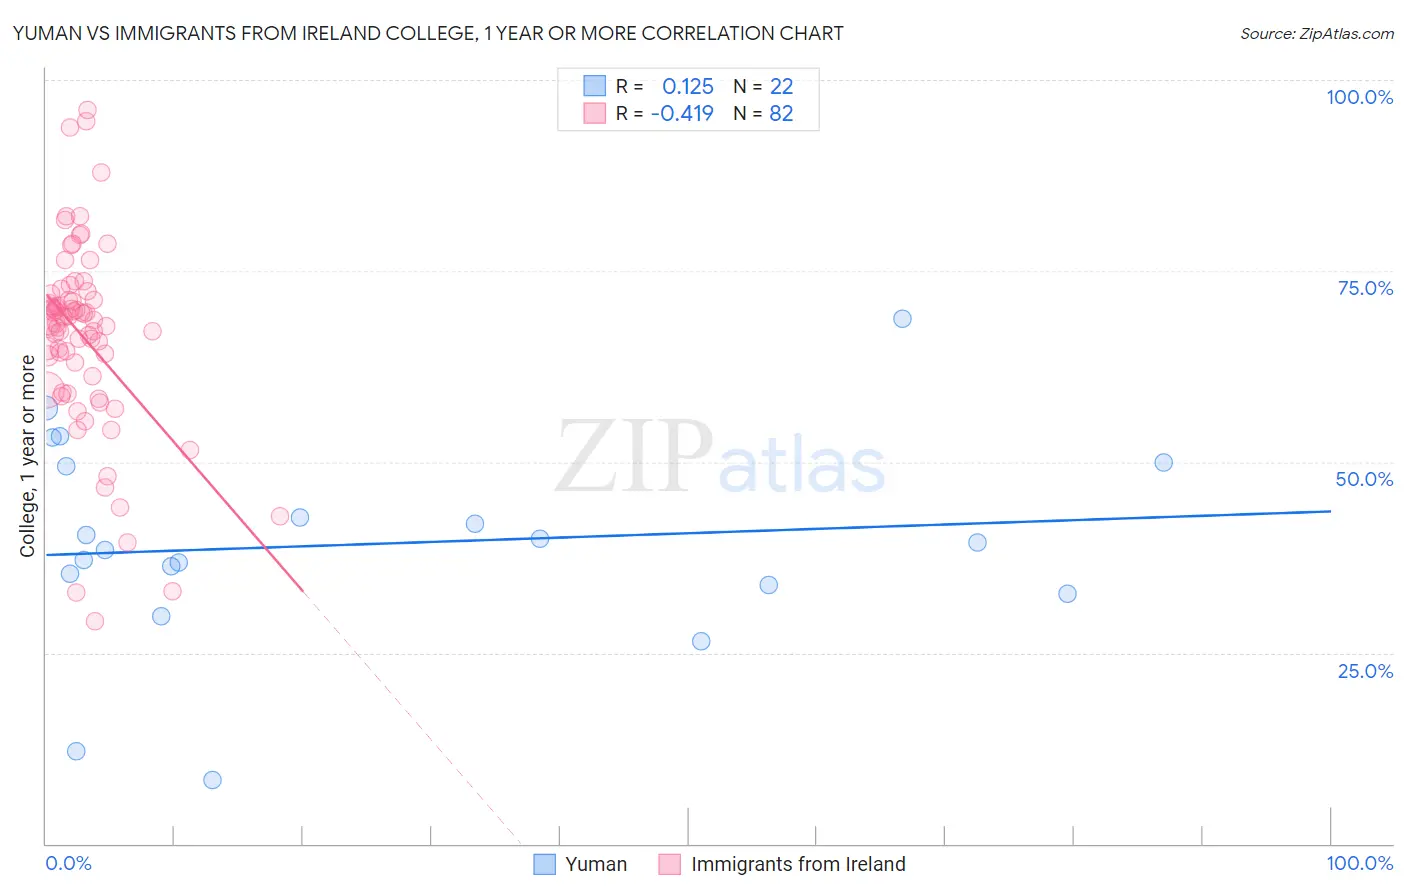
Yuman vs Immigrants from Ireland College, 1 year or more Correlation Chart
The statistical analysis conducted on geographies consisting of 40,696,202 people shows a poor positive correlation between the proportion of Yuman and percentage of population with at least college, 1 year or more education in the United States with a correlation coefficient (R) of 0.125 and weighted average of 48.7%. Similarly, the statistical analysis conducted on geographies consisting of 240,784,591 people shows a moderate negative correlation between the proportion of Immigrants from Ireland and percentage of population with at least college, 1 year or more education in the United States with a correlation coefficient (R) of -0.419 and weighted average of 65.9%, a difference of 35.3%.
College, 1 year or more Correlation Summary
| Measurement | Yuman | Immigrants from Ireland |
| Minimum | 8.3% | 29.2% |
| Maximum | 68.8% | 96.0% |
| Range | 60.4% | 66.9% |
| Mean | 39.3% | 66.5% |
| Median | 39.0% | 68.4% |
| Interquartile 25% (IQ1) | 34.0% | 61.1% |
| Interquartile 75% (IQ3) | 49.5% | 71.3% |
| Interquartile Range (IQR) | 15.5% | 10.1% |
| Standard Deviation (Sample) | 13.6% | 12.4% |
| Standard Deviation (Population) | 13.3% | 12.4% |
Similar Demographics by College, 1 year or more
Demographics Similar to Yuman by College, 1 year or more
In terms of college, 1 year or more, the demographic groups most similar to Yuman are Lumbee (48.9%, a difference of 0.28%), Spanish American Indian (48.5%, a difference of 0.44%), Pennsylvania German (48.5%, a difference of 0.45%), Immigrants from Central America (48.5%, a difference of 0.50%), and Immigrants from the Azores (48.4%, a difference of 0.76%).
| Demographics | Rating | Rank | College, 1 year or more |
| Dutch West Indians | 0.0 /100 | #328 | Tragic 50.5% |
| Cape Verdeans | 0.0 /100 | #329 | Tragic 50.3% |
| Natives/Alaskans | 0.0 /100 | #330 | Tragic 50.2% |
| Immigrants | Yemen | 0.0 /100 | #331 | Tragic 50.0% |
| Mexicans | 0.0 /100 | #332 | Tragic 49.2% |
| Immigrants | Dominican Republic | 0.0 /100 | #333 | Tragic 49.1% |
| Lumbee | 0.0 /100 | #334 | Tragic 48.9% |
| Yuman | 0.0 /100 | #335 | Tragic 48.7% |
| Spanish American Indians | 0.0 /100 | #336 | Tragic 48.5% |
| Pennsylvania Germans | 0.0 /100 | #337 | Tragic 48.5% |
| Immigrants | Central America | 0.0 /100 | #338 | Tragic 48.5% |
| Immigrants | Azores | 0.0 /100 | #339 | Tragic 48.4% |
| Immigrants | Cabo Verde | 0.0 /100 | #340 | Tragic 48.1% |
| Immigrants | Mexico | 0.0 /100 | #341 | Tragic 47.5% |
| Inupiat | 0.0 /100 | #342 | Tragic 47.2% |
Demographics Similar to Immigrants from Ireland by College, 1 year or more
In terms of college, 1 year or more, the demographic groups most similar to Immigrants from Ireland are Immigrants from France (65.8%, a difference of 0.17%), Latvian (66.1%, a difference of 0.20%), Indian (Asian) (66.1%, a difference of 0.24%), Immigrants from Northern Europe (65.6%, a difference of 0.42%), and Immigrants from Denmark (65.6%, a difference of 0.53%).
| Demographics | Rating | Rank | College, 1 year or more |
| Immigrants | Korea | 100.0 /100 | #20 | Exceptional 66.5% |
| Immigrants | Hong Kong | 100.0 /100 | #21 | Exceptional 66.4% |
| Soviet Union | 100.0 /100 | #22 | Exceptional 66.4% |
| Immigrants | China | 100.0 /100 | #23 | Exceptional 66.4% |
| Immigrants | Belgium | 100.0 /100 | #24 | Exceptional 66.3% |
| Indians (Asian) | 100.0 /100 | #25 | Exceptional 66.1% |
| Latvians | 100.0 /100 | #26 | Exceptional 66.1% |
| Immigrants | Ireland | 100.0 /100 | #27 | Exceptional 65.9% |
| Immigrants | France | 100.0 /100 | #28 | Exceptional 65.8% |
| Immigrants | Northern Europe | 100.0 /100 | #29 | Exceptional 65.6% |
| Immigrants | Denmark | 100.0 /100 | #30 | Exceptional 65.6% |
| Turks | 100.0 /100 | #31 | Exceptional 65.5% |
| Bulgarians | 100.0 /100 | #32 | Exceptional 65.5% |
| Immigrants | Sri Lanka | 99.9 /100 | #33 | Exceptional 65.4% |
| Israelis | 99.9 /100 | #34 | Exceptional 65.3% |