Immigrants from Eritrea vs Honduran Disability
COMPARE
Immigrants from Eritrea
Honduran
Disability
Disability Comparison
Immigrants from Eritrea
Hondurans
11.0%
DISABILITY
99.7/ 100
METRIC RATING
63rd/ 347
METRIC RANK
11.8%
DISABILITY
31.2/ 100
METRIC RATING
183rd/ 347
METRIC RANK
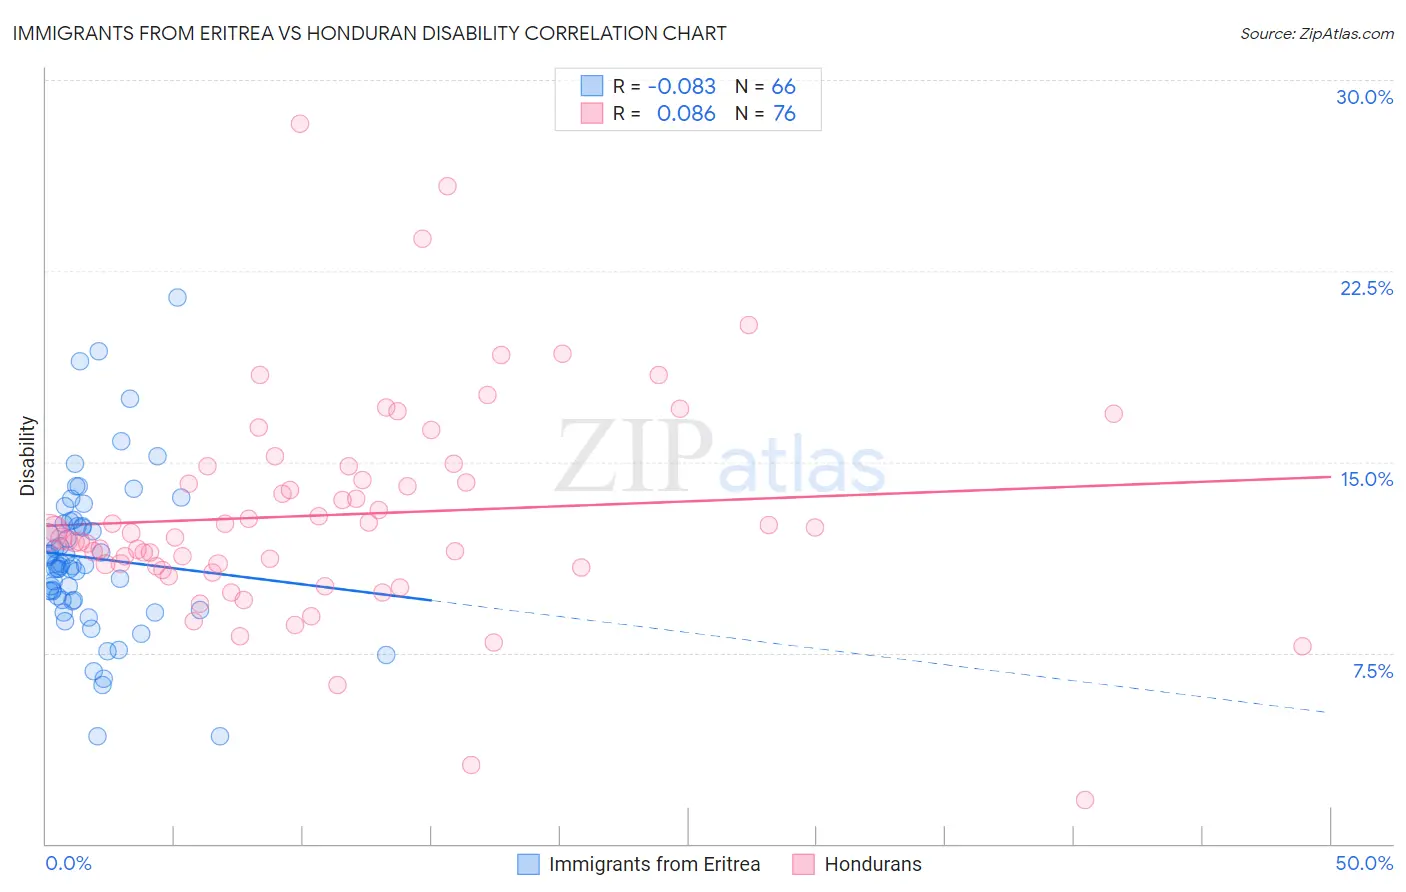
Immigrants from Eritrea vs Honduran Disability Correlation Chart
The statistical analysis conducted on geographies consisting of 104,852,788 people shows a slight negative correlation between the proportion of Immigrants from Eritrea and percentage of population with a disability in the United States with a correlation coefficient (R) of -0.083 and weighted average of 11.0%. Similarly, the statistical analysis conducted on geographies consisting of 357,777,033 people shows a slight positive correlation between the proportion of Hondurans and percentage of population with a disability in the United States with a correlation coefficient (R) of 0.086 and weighted average of 11.8%, a difference of 7.8%.
Disability Correlation Summary
| Measurement | Immigrants from Eritrea | Honduran |
| Minimum | 4.2% | 1.7% |
| Maximum | 21.4% | 28.3% |
| Range | 17.2% | 26.6% |
| Mean | 11.2% | 12.9% |
| Median | 10.9% | 12.1% |
| Interquartile 25% (IQ1) | 9.6% | 10.9% |
| Interquartile 75% (IQ3) | 12.6% | 14.6% |
| Interquartile Range (IQR) | 3.0% | 3.7% |
| Standard Deviation (Sample) | 3.2% | 4.3% |
| Standard Deviation (Population) | 3.1% | 4.2% |
Similar Demographics by Disability
Demographics Similar to Immigrants from Eritrea by Disability
In terms of disability, the demographic groups most similar to Immigrants from Eritrea are Immigrants from Northern Africa (10.9%, a difference of 0.020%), Immigrants from Bulgaria (10.9%, a difference of 0.060%), Zimbabwean (10.9%, a difference of 0.11%), Immigrants from Sweden (11.0%, a difference of 0.18%), and Bulgarian (11.0%, a difference of 0.20%).
| Demographics | Rating | Rank | Disability |
| Immigrants | Lithuania | 99.8 /100 | #56 | Exceptional 10.9% |
| Salvadorans | 99.8 /100 | #57 | Exceptional 10.9% |
| Immigrants | South America | 99.8 /100 | #58 | Exceptional 10.9% |
| Immigrants | Colombia | 99.7 /100 | #59 | Exceptional 10.9% |
| Zimbabweans | 99.7 /100 | #60 | Exceptional 10.9% |
| Immigrants | Bulgaria | 99.7 /100 | #61 | Exceptional 10.9% |
| Immigrants | Northern Africa | 99.7 /100 | #62 | Exceptional 10.9% |
| Immigrants | Eritrea | 99.7 /100 | #63 | Exceptional 11.0% |
| Immigrants | Sweden | 99.6 /100 | #64 | Exceptional 11.0% |
| Bulgarians | 99.6 /100 | #65 | Exceptional 11.0% |
| Laotians | 99.6 /100 | #66 | Exceptional 11.0% |
| Colombians | 99.6 /100 | #67 | Exceptional 11.0% |
| Immigrants | Afghanistan | 99.6 /100 | #68 | Exceptional 11.0% |
| Sri Lankans | 99.5 /100 | #69 | Exceptional 11.0% |
| Immigrants | France | 99.4 /100 | #70 | Exceptional 11.0% |
Demographics Similar to Hondurans by Disability
In terms of disability, the demographic groups most similar to Hondurans are Iraqi (11.8%, a difference of 0.060%), Icelander (11.8%, a difference of 0.14%), Immigrants from Burma/Myanmar (11.8%, a difference of 0.14%), Immigrants from Oceania (11.8%, a difference of 0.15%), and Immigrants from Scotland (11.8%, a difference of 0.16%).
| Demographics | Rating | Rank | Disability |
| Immigrants | Western Africa | 47.5 /100 | #176 | Average 11.7% |
| Immigrants | Central America | 46.6 /100 | #177 | Average 11.7% |
| Greeks | 46.2 /100 | #178 | Average 11.7% |
| Immigrants | Armenia | 41.9 /100 | #179 | Average 11.7% |
| Immigrants | Honduras | 37.8 /100 | #180 | Fair 11.8% |
| Immigrants | Oceania | 34.3 /100 | #181 | Fair 11.8% |
| Icelanders | 34.0 /100 | #182 | Fair 11.8% |
| Hondurans | 31.2 /100 | #183 | Fair 11.8% |
| Iraqis | 30.0 /100 | #184 | Fair 11.8% |
| Immigrants | Burma/Myanmar | 28.5 /100 | #185 | Fair 11.8% |
| Immigrants | Scotland | 28.2 /100 | #186 | Fair 11.8% |
| Lebanese | 27.9 /100 | #187 | Fair 11.8% |
| Immigrants | Mexico | 23.8 /100 | #188 | Fair 11.9% |
| Immigrants | Zaire | 21.8 /100 | #189 | Fair 11.9% |
| Immigrants | West Indies | 21.1 /100 | #190 | Fair 11.9% |