Chickasaw vs Honduran Disability
COMPARE
Chickasaw
Honduran
Disability
Disability Comparison
Chickasaw
Hondurans
15.2%
DISABILITY
0.0/ 100
METRIC RATING
339th/ 347
METRIC RANK
11.8%
DISABILITY
31.2/ 100
METRIC RATING
183rd/ 347
METRIC RANK
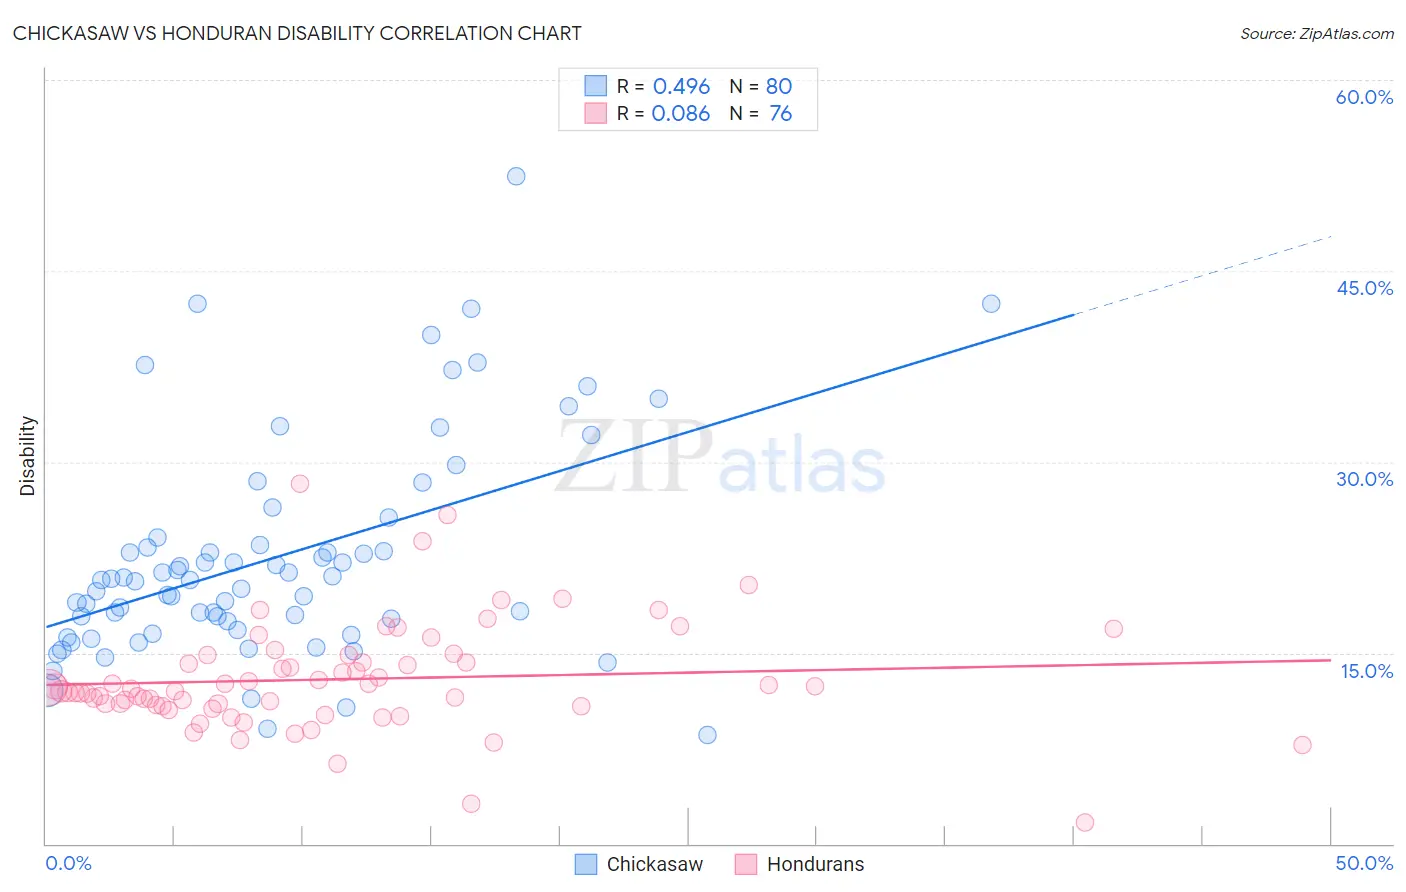
Chickasaw vs Honduran Disability Correlation Chart
The statistical analysis conducted on geographies consisting of 147,689,192 people shows a moderate positive correlation between the proportion of Chickasaw and percentage of population with a disability in the United States with a correlation coefficient (R) of 0.496 and weighted average of 15.2%. Similarly, the statistical analysis conducted on geographies consisting of 357,777,033 people shows a slight positive correlation between the proportion of Hondurans and percentage of population with a disability in the United States with a correlation coefficient (R) of 0.086 and weighted average of 11.8%, a difference of 28.6%.
Disability Correlation Summary
| Measurement | Chickasaw | Honduran |
| Minimum | 8.6% | 1.7% |
| Maximum | 52.4% | 28.3% |
| Range | 43.9% | 26.6% |
| Mean | 22.5% | 12.9% |
| Median | 20.7% | 12.1% |
| Interquartile 25% (IQ1) | 17.1% | 10.9% |
| Interquartile 75% (IQ3) | 23.7% | 14.6% |
| Interquartile Range (IQR) | 6.6% | 3.7% |
| Standard Deviation (Sample) | 8.6% | 4.3% |
| Standard Deviation (Population) | 8.5% | 4.2% |
Similar Demographics by Disability
Demographics Similar to Chickasaw by Disability
In terms of disability, the demographic groups most similar to Chickasaw are Choctaw (15.4%, a difference of 1.5%), Dutch West Indian (14.9%, a difference of 1.8%), Seminole (14.9%, a difference of 2.1%), Cherokee (14.8%, a difference of 2.2%), and Lumbee (15.5%, a difference of 2.3%).
| Demographics | Rating | Rank | Disability |
| Pueblo | 0.0 /100 | #332 | Tragic 14.4% |
| Cajuns | 0.0 /100 | #333 | Tragic 14.6% |
| Yuman | 0.0 /100 | #334 | Tragic 14.6% |
| Tohono O'odham | 0.0 /100 | #335 | Tragic 14.8% |
| Cherokee | 0.0 /100 | #336 | Tragic 14.8% |
| Seminole | 0.0 /100 | #337 | Tragic 14.9% |
| Dutch West Indians | 0.0 /100 | #338 | Tragic 14.9% |
| Chickasaw | 0.0 /100 | #339 | Tragic 15.2% |
| Choctaw | 0.0 /100 | #340 | Tragic 15.4% |
| Lumbee | 0.0 /100 | #341 | Tragic 15.5% |
| Kiowa | 0.0 /100 | #342 | Tragic 15.6% |
| Creek | 0.0 /100 | #343 | Tragic 15.6% |
| Colville | 0.0 /100 | #344 | Tragic 15.8% |
| Puerto Ricans | 0.0 /100 | #345 | Tragic 16.1% |
| Tsimshian | 0.0 /100 | #346 | Tragic 16.1% |
Demographics Similar to Hondurans by Disability
In terms of disability, the demographic groups most similar to Hondurans are Iraqi (11.8%, a difference of 0.060%), Icelander (11.8%, a difference of 0.14%), Immigrants from Burma/Myanmar (11.8%, a difference of 0.14%), Immigrants from Oceania (11.8%, a difference of 0.15%), and Immigrants from Scotland (11.8%, a difference of 0.16%).
| Demographics | Rating | Rank | Disability |
| Immigrants | Western Africa | 47.5 /100 | #176 | Average 11.7% |
| Immigrants | Central America | 46.6 /100 | #177 | Average 11.7% |
| Greeks | 46.2 /100 | #178 | Average 11.7% |
| Immigrants | Armenia | 41.9 /100 | #179 | Average 11.7% |
| Immigrants | Honduras | 37.8 /100 | #180 | Fair 11.8% |
| Immigrants | Oceania | 34.3 /100 | #181 | Fair 11.8% |
| Icelanders | 34.0 /100 | #182 | Fair 11.8% |
| Hondurans | 31.2 /100 | #183 | Fair 11.8% |
| Iraqis | 30.0 /100 | #184 | Fair 11.8% |
| Immigrants | Burma/Myanmar | 28.5 /100 | #185 | Fair 11.8% |
| Immigrants | Scotland | 28.2 /100 | #186 | Fair 11.8% |
| Lebanese | 27.9 /100 | #187 | Fair 11.8% |
| Immigrants | Mexico | 23.8 /100 | #188 | Fair 11.9% |
| Immigrants | Zaire | 21.8 /100 | #189 | Fair 11.9% |
| Immigrants | West Indies | 21.1 /100 | #190 | Fair 11.9% |