Swiss vs Indonesian Disability Age Over 75
COMPARE
Swiss
Indonesian
Disability Age Over 75
Disability Age Over 75 Comparison
Swiss
Indonesians
46.2%
DISABILITY AGE OVER 75
98.8/ 100
METRIC RATING
79th/ 347
METRIC RANK
48.2%
DISABILITY AGE OVER 75
4.2/ 100
METRIC RATING
232nd/ 347
METRIC RANK
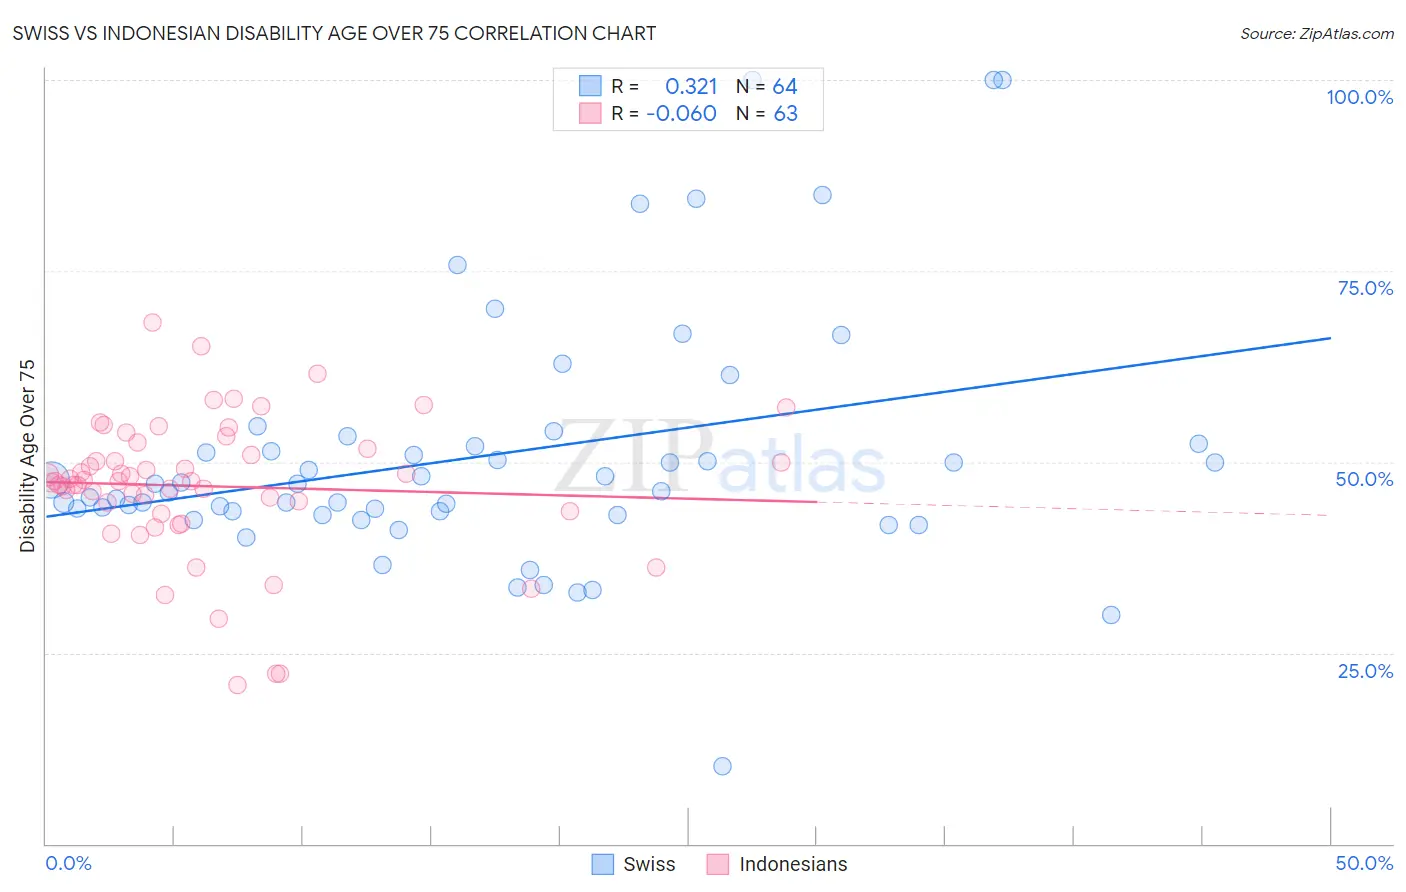
Swiss vs Indonesian Disability Age Over 75 Correlation Chart
The statistical analysis conducted on geographies consisting of 464,270,754 people shows a mild positive correlation between the proportion of Swiss and percentage of population with a disability over the age of 75 in the United States with a correlation coefficient (R) of 0.321 and weighted average of 46.2%. Similarly, the statistical analysis conducted on geographies consisting of 162,478,519 people shows a slight negative correlation between the proportion of Indonesians and percentage of population with a disability over the age of 75 in the United States with a correlation coefficient (R) of -0.060 and weighted average of 48.2%, a difference of 4.3%.
Disability Age Over 75 Correlation Summary
| Measurement | Swiss | Indonesian |
| Minimum | 10.2% | 20.8% |
| Maximum | 100.0% | 68.2% |
| Range | 89.8% | 47.4% |
| Mean | 50.9% | 46.8% |
| Median | 46.6% | 47.5% |
| Interquartile 25% (IQ1) | 43.3% | 43.5% |
| Interquartile 75% (IQ3) | 52.2% | 51.7% |
| Interquartile Range (IQR) | 8.9% | 8.3% |
| Standard Deviation (Sample) | 16.7% | 9.2% |
| Standard Deviation (Population) | 16.5% | 9.1% |
Similar Demographics by Disability Age Over 75
Demographics Similar to Swiss by Disability Age Over 75
In terms of disability age over 75, the demographic groups most similar to Swiss are Soviet Union (46.2%, a difference of 0.0%), New Zealander (46.2%, a difference of 0.010%), Immigrants from Latvia (46.2%, a difference of 0.030%), Argentinean (46.2%, a difference of 0.030%), and Immigrants from Western Europe (46.2%, a difference of 0.040%).
| Demographics | Rating | Rank | Disability Age Over 75 |
| Immigrants | Hungary | 99.1 /100 | #72 | Exceptional 46.1% |
| Cambodians | 99.1 /100 | #73 | Exceptional 46.1% |
| Egyptians | 99.0 /100 | #74 | Exceptional 46.1% |
| Serbians | 99.0 /100 | #75 | Exceptional 46.1% |
| Slavs | 98.9 /100 | #76 | Exceptional 46.1% |
| Immigrants | Eastern Asia | 98.9 /100 | #77 | Exceptional 46.2% |
| Immigrants | Western Europe | 98.8 /100 | #78 | Exceptional 46.2% |
| Swiss | 98.8 /100 | #79 | Exceptional 46.2% |
| Soviet Union | 98.8 /100 | #80 | Exceptional 46.2% |
| New Zealanders | 98.8 /100 | #81 | Exceptional 46.2% |
| Immigrants | Latvia | 98.7 /100 | #82 | Exceptional 46.2% |
| Argentineans | 98.7 /100 | #83 | Exceptional 46.2% |
| Immigrants | Jordan | 98.7 /100 | #84 | Exceptional 46.2% |
| Immigrants | Southern Europe | 98.6 /100 | #85 | Exceptional 46.2% |
| Romanians | 98.6 /100 | #86 | Exceptional 46.2% |
Demographics Similar to Indonesians by Disability Age Over 75
In terms of disability age over 75, the demographic groups most similar to Indonesians are Cree (48.2%, a difference of 0.0%), Immigrants (48.2%, a difference of 0.010%), Taiwanese (48.2%, a difference of 0.030%), Subsaharan African (48.2%, a difference of 0.060%), and Hmong (48.2%, a difference of 0.070%).
| Demographics | Rating | Rank | Disability Age Over 75 |
| Spanish | 6.5 /100 | #225 | Tragic 48.0% |
| Immigrants | Nonimmigrants | 6.5 /100 | #226 | Tragic 48.0% |
| Zimbabweans | 6.4 /100 | #227 | Tragic 48.1% |
| Immigrants | Liberia | 5.9 /100 | #228 | Tragic 48.1% |
| Spaniards | 5.7 /100 | #229 | Tragic 48.1% |
| Taiwanese | 4.4 /100 | #230 | Tragic 48.2% |
| Immigrants | Immigrants | 4.3 /100 | #231 | Tragic 48.2% |
| Indonesians | 4.2 /100 | #232 | Tragic 48.2% |
| Cree | 4.2 /100 | #233 | Tragic 48.2% |
| Sub-Saharan Africans | 3.8 /100 | #234 | Tragic 48.2% |
| Hmong | 3.8 /100 | #235 | Tragic 48.2% |
| Immigrants | Nicaragua | 3.2 /100 | #236 | Tragic 48.2% |
| Immigrants | St. Vincent and the Grenadines | 3.2 /100 | #237 | Tragic 48.2% |
| Nicaraguans | 3.0 /100 | #238 | Tragic 48.3% |
| Immigrants | Thailand | 2.8 /100 | #239 | Tragic 48.3% |