Yup'ik vs Indonesian Disability Age Over 75
COMPARE
Yup'ik
Indonesian
Disability Age Over 75
Disability Age Over 75 Comparison
Yup'ik
Indonesians
61.1%
DISABILITY AGE OVER 75
0.0/ 100
METRIC RATING
347th/ 347
METRIC RANK
48.2%
DISABILITY AGE OVER 75
4.2/ 100
METRIC RATING
232nd/ 347
METRIC RANK
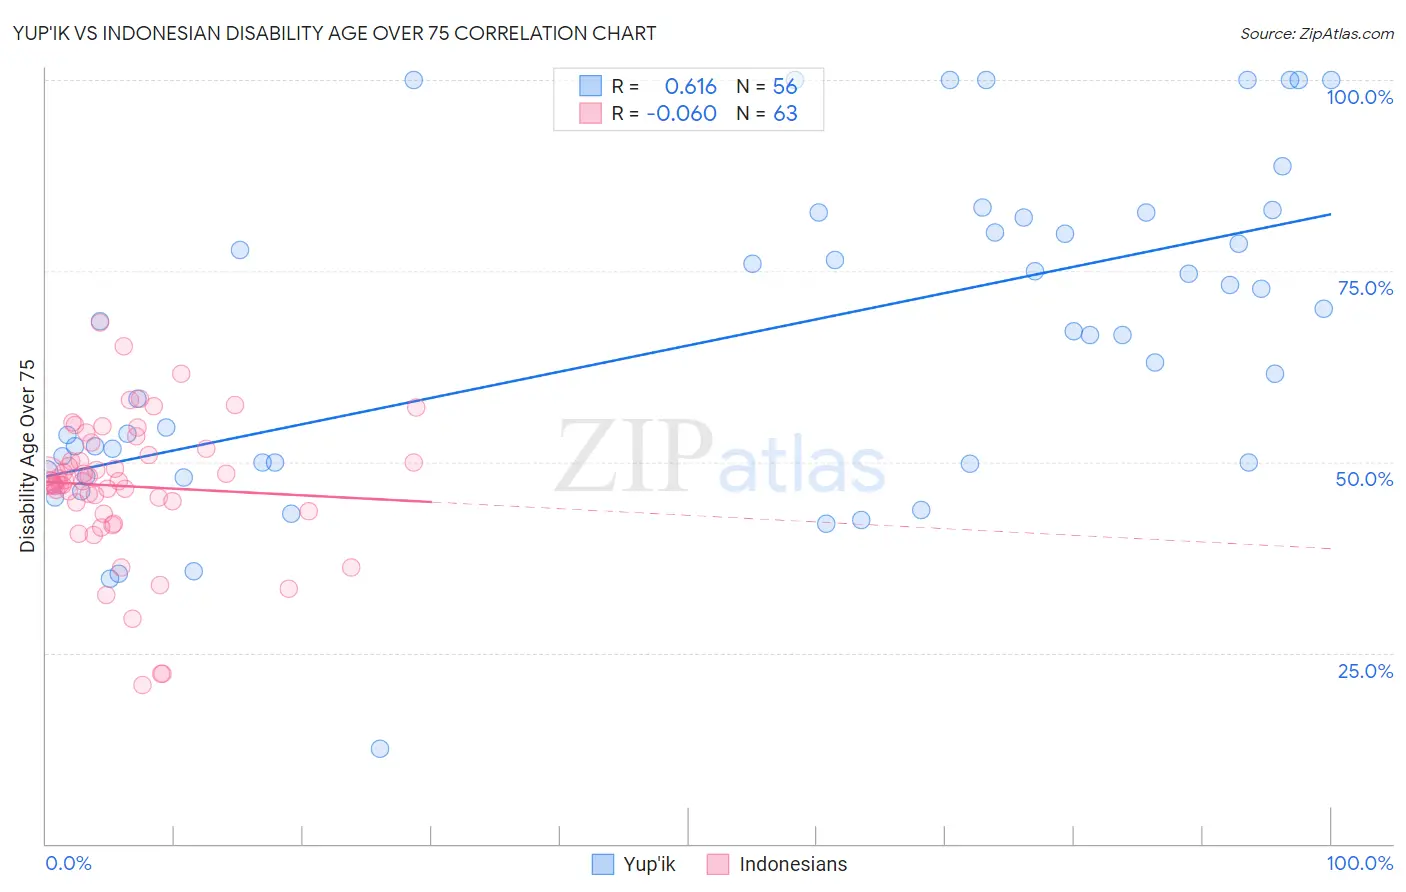
Yup'ik vs Indonesian Disability Age Over 75 Correlation Chart
The statistical analysis conducted on geographies consisting of 39,925,791 people shows a significant positive correlation between the proportion of Yup'ik and percentage of population with a disability over the age of 75 in the United States with a correlation coefficient (R) of 0.616 and weighted average of 61.1%. Similarly, the statistical analysis conducted on geographies consisting of 162,478,519 people shows a slight negative correlation between the proportion of Indonesians and percentage of population with a disability over the age of 75 in the United States with a correlation coefficient (R) of -0.060 and weighted average of 48.2%, a difference of 26.9%.
Disability Age Over 75 Correlation Summary
| Measurement | Yup'ik | Indonesian |
| Minimum | 12.5% | 20.8% |
| Maximum | 100.0% | 68.2% |
| Range | 87.5% | 47.4% |
| Mean | 65.7% | 46.8% |
| Median | 66.7% | 47.5% |
| Interquartile 25% (IQ1) | 49.8% | 43.5% |
| Interquartile 75% (IQ3) | 81.0% | 51.7% |
| Interquartile Range (IQR) | 31.2% | 8.3% |
| Standard Deviation (Sample) | 21.0% | 9.2% |
| Standard Deviation (Population) | 20.8% | 9.1% |
Similar Demographics by Disability Age Over 75
Demographics Similar to Yup'ik by Disability Age Over 75
In terms of disability age over 75, the demographic groups most similar to Yup'ik are Tsimshian (59.2%, a difference of 3.2%), Inupiat (58.4%, a difference of 4.6%), Navajo (58.3%, a difference of 4.9%), Tohono O'odham (56.7%, a difference of 7.7%), and Lumbee (56.2%, a difference of 8.6%).
| Demographics | Rating | Rank | Disability Age Over 75 |
| Apache | 0.0 /100 | #333 | Tragic 53.6% |
| Alaskan Athabascans | 0.0 /100 | #334 | Tragic 54.0% |
| Kiowa | 0.0 /100 | #335 | Tragic 54.2% |
| Immigrants | Armenia | 0.0 /100 | #336 | Tragic 54.3% |
| Yuman | 0.0 /100 | #337 | Tragic 54.4% |
| Colville | 0.0 /100 | #338 | Tragic 55.4% |
| Pima | 0.0 /100 | #339 | Tragic 55.8% |
| Pueblo | 0.0 /100 | #340 | Tragic 55.9% |
| Houma | 0.0 /100 | #341 | Tragic 56.2% |
| Lumbee | 0.0 /100 | #342 | Tragic 56.2% |
| Tohono O'odham | 0.0 /100 | #343 | Tragic 56.7% |
| Navajo | 0.0 /100 | #344 | Tragic 58.3% |
| Inupiat | 0.0 /100 | #345 | Tragic 58.4% |
| Tsimshian | 0.0 /100 | #346 | Tragic 59.2% |
| Yup'ik | 0.0 /100 | #347 | Tragic 61.1% |
Demographics Similar to Indonesians by Disability Age Over 75
In terms of disability age over 75, the demographic groups most similar to Indonesians are Cree (48.2%, a difference of 0.0%), Immigrants (48.2%, a difference of 0.010%), Taiwanese (48.2%, a difference of 0.030%), Subsaharan African (48.2%, a difference of 0.060%), and Hmong (48.2%, a difference of 0.070%).
| Demographics | Rating | Rank | Disability Age Over 75 |
| Spanish | 6.5 /100 | #225 | Tragic 48.0% |
| Immigrants | Nonimmigrants | 6.5 /100 | #226 | Tragic 48.0% |
| Zimbabweans | 6.4 /100 | #227 | Tragic 48.1% |
| Immigrants | Liberia | 5.9 /100 | #228 | Tragic 48.1% |
| Spaniards | 5.7 /100 | #229 | Tragic 48.1% |
| Taiwanese | 4.4 /100 | #230 | Tragic 48.2% |
| Immigrants | Immigrants | 4.3 /100 | #231 | Tragic 48.2% |
| Indonesians | 4.2 /100 | #232 | Tragic 48.2% |
| Cree | 4.2 /100 | #233 | Tragic 48.2% |
| Sub-Saharan Africans | 3.8 /100 | #234 | Tragic 48.2% |
| Hmong | 3.8 /100 | #235 | Tragic 48.2% |
| Immigrants | Nicaragua | 3.2 /100 | #236 | Tragic 48.2% |
| Immigrants | St. Vincent and the Grenadines | 3.2 /100 | #237 | Tragic 48.2% |
| Nicaraguans | 3.0 /100 | #238 | Tragic 48.3% |
| Immigrants | Thailand | 2.8 /100 | #239 | Tragic 48.3% |