Immigrants from Honduras vs Immigrants from Taiwan Disability
COMPARE
Immigrants from Honduras
Immigrants from Taiwan
Disability
Disability Comparison
Immigrants from Honduras
Immigrants from Taiwan
11.8%
DISABILITY
37.8/ 100
METRIC RATING
180th/ 347
METRIC RANK
9.6%
DISABILITY
100.0/ 100
METRIC RATING
3rd/ 347
METRIC RANK
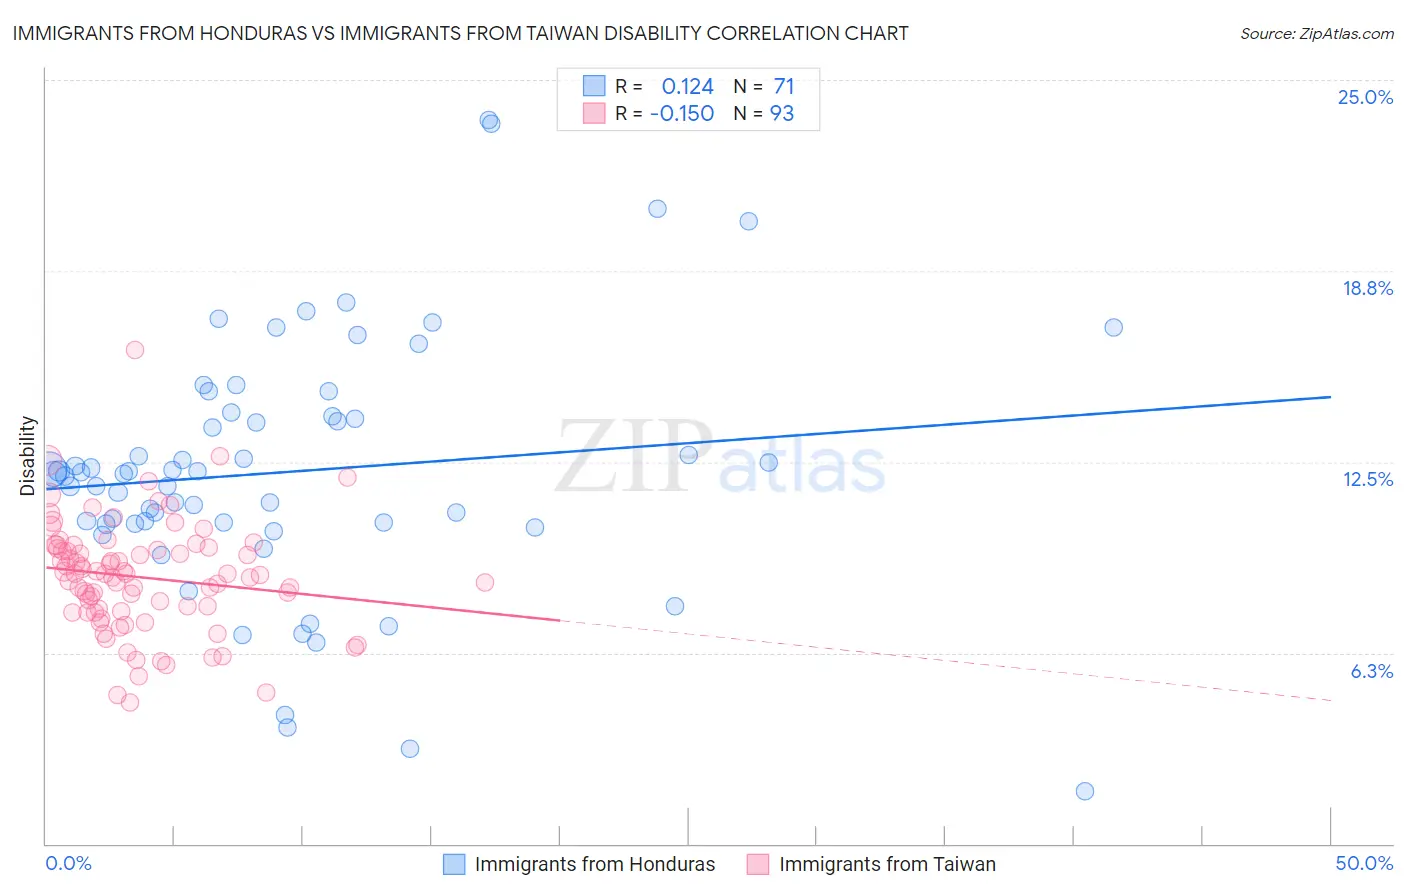
Immigrants from Honduras vs Immigrants from Taiwan Disability Correlation Chart
The statistical analysis conducted on geographies consisting of 322,561,761 people shows a poor positive correlation between the proportion of Immigrants from Honduras and percentage of population with a disability in the United States with a correlation coefficient (R) of 0.124 and weighted average of 11.8%. Similarly, the statistical analysis conducted on geographies consisting of 298,248,980 people shows a poor negative correlation between the proportion of Immigrants from Taiwan and percentage of population with a disability in the United States with a correlation coefficient (R) of -0.150 and weighted average of 9.6%, a difference of 22.5%.
Disability Correlation Summary
| Measurement | Immigrants from Honduras | Immigrants from Taiwan |
| Minimum | 1.7% | 4.6% |
| Maximum | 23.7% | 16.2% |
| Range | 22.0% | 11.5% |
| Mean | 12.2% | 8.7% |
| Median | 12.1% | 8.8% |
| Interquartile 25% (IQ1) | 10.5% | 7.6% |
| Interquartile 75% (IQ3) | 14.0% | 9.7% |
| Interquartile Range (IQR) | 3.5% | 2.1% |
| Standard Deviation (Sample) | 4.1% | 1.8% |
| Standard Deviation (Population) | 4.1% | 1.8% |
Similar Demographics by Disability
Demographics Similar to Immigrants from Honduras by Disability
In terms of disability, the demographic groups most similar to Immigrants from Honduras are Immigrants from Oceania (11.8%, a difference of 0.17%), Immigrants from Armenia (11.7%, a difference of 0.19%), Icelander (11.8%, a difference of 0.19%), Honduran (11.8%, a difference of 0.32%), and Greek (11.7%, a difference of 0.38%).
| Demographics | Rating | Rank | Disability |
| Maltese | 50.6 /100 | #173 | Average 11.7% |
| Albanians | 50.0 /100 | #174 | Average 11.7% |
| Haitians | 48.6 /100 | #175 | Average 11.7% |
| Immigrants | Western Africa | 47.5 /100 | #176 | Average 11.7% |
| Immigrants | Central America | 46.6 /100 | #177 | Average 11.7% |
| Greeks | 46.2 /100 | #178 | Average 11.7% |
| Immigrants | Armenia | 41.9 /100 | #179 | Average 11.7% |
| Immigrants | Honduras | 37.8 /100 | #180 | Fair 11.8% |
| Immigrants | Oceania | 34.3 /100 | #181 | Fair 11.8% |
| Icelanders | 34.0 /100 | #182 | Fair 11.8% |
| Hondurans | 31.2 /100 | #183 | Fair 11.8% |
| Iraqis | 30.0 /100 | #184 | Fair 11.8% |
| Immigrants | Burma/Myanmar | 28.5 /100 | #185 | Fair 11.8% |
| Immigrants | Scotland | 28.2 /100 | #186 | Fair 11.8% |
| Lebanese | 27.9 /100 | #187 | Fair 11.8% |
Demographics Similar to Immigrants from Taiwan by Disability
In terms of disability, the demographic groups most similar to Immigrants from Taiwan are Filipino (9.6%, a difference of 0.080%), Immigrants from India (9.5%, a difference of 1.1%), Thai (9.7%, a difference of 1.1%), Immigrants from Bolivia (9.9%, a difference of 2.7%), and Immigrants from South Central Asia (9.9%, a difference of 3.6%).
| Demographics | Rating | Rank | Disability |
| Immigrants | India | 100.0 /100 | #1 | Exceptional 9.5% |
| Filipinos | 100.0 /100 | #2 | Exceptional 9.6% |
| Immigrants | Taiwan | 100.0 /100 | #3 | Exceptional 9.6% |
| Thais | 100.0 /100 | #4 | Exceptional 9.7% |
| Immigrants | Bolivia | 100.0 /100 | #5 | Exceptional 9.9% |
| Immigrants | South Central Asia | 100.0 /100 | #6 | Exceptional 9.9% |
| Immigrants | Singapore | 100.0 /100 | #7 | Exceptional 10.0% |
| Bolivians | 100.0 /100 | #8 | Exceptional 10.0% |
| Immigrants | Hong Kong | 100.0 /100 | #9 | Exceptional 10.0% |
| Immigrants | China | 100.0 /100 | #10 | Exceptional 10.1% |
| Iranians | 100.0 /100 | #11 | Exceptional 10.1% |
| Immigrants | Israel | 100.0 /100 | #12 | Exceptional 10.1% |
| Immigrants | Eastern Asia | 100.0 /100 | #13 | Exceptional 10.2% |
| Immigrants | Korea | 100.0 /100 | #14 | Exceptional 10.2% |
| Okinawans | 100.0 /100 | #15 | Exceptional 10.3% |