Immigrants from Austria vs Immigrants from Taiwan Disability
COMPARE
Immigrants from Austria
Immigrants from Taiwan
Disability
Disability Comparison
Immigrants from Austria
Immigrants from Taiwan
11.7%
DISABILITY
53.4/ 100
METRIC RATING
169th/ 347
METRIC RANK
9.6%
DISABILITY
100.0/ 100
METRIC RATING
3rd/ 347
METRIC RANK
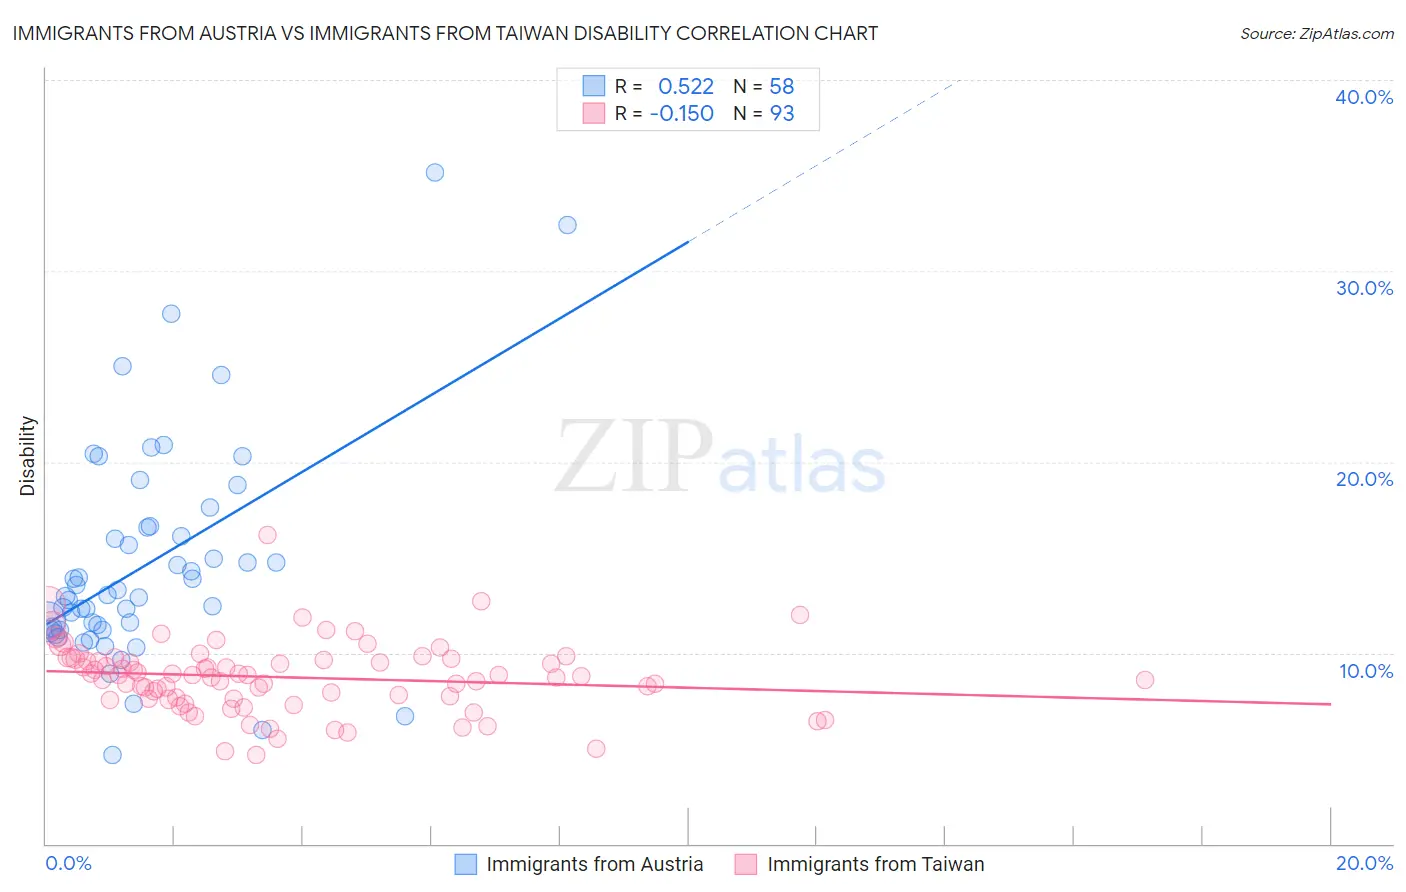
Immigrants from Austria vs Immigrants from Taiwan Disability Correlation Chart
The statistical analysis conducted on geographies consisting of 167,973,413 people shows a substantial positive correlation between the proportion of Immigrants from Austria and percentage of population with a disability in the United States with a correlation coefficient (R) of 0.522 and weighted average of 11.7%. Similarly, the statistical analysis conducted on geographies consisting of 298,248,980 people shows a poor negative correlation between the proportion of Immigrants from Taiwan and percentage of population with a disability in the United States with a correlation coefficient (R) of -0.150 and weighted average of 9.6%, a difference of 21.6%.
Disability Correlation Summary
| Measurement | Immigrants from Austria | Immigrants from Taiwan |
| Minimum | 4.6% | 4.6% |
| Maximum | 35.2% | 16.2% |
| Range | 30.5% | 11.5% |
| Mean | 14.6% | 8.7% |
| Median | 13.0% | 8.8% |
| Interquartile 25% (IQ1) | 11.2% | 7.6% |
| Interquartile 75% (IQ3) | 16.5% | 9.7% |
| Interquartile Range (IQR) | 5.3% | 2.1% |
| Standard Deviation (Sample) | 5.8% | 1.8% |
| Standard Deviation (Population) | 5.8% | 1.8% |
Similar Demographics by Disability
Demographics Similar to Immigrants from Austria by Disability
In terms of disability, the demographic groups most similar to Immigrants from Austria are Immigrants from Latin America (11.7%, a difference of 0.030%), Immigrants from Albania (11.7%, a difference of 0.030%), Immigrants from Southern Europe (11.7%, a difference of 0.030%), Trinidadian and Tobagonian (11.7%, a difference of 0.030%), and Estonian (11.7%, a difference of 0.050%).
| Demographics | Rating | Rank | Disability |
| Immigrants | Haiti | 59.2 /100 | #162 | Average 11.7% |
| Immigrants | Trinidad and Tobago | 58.9 /100 | #163 | Average 11.7% |
| Syrians | 58.5 /100 | #164 | Average 11.7% |
| Cubans | 56.7 /100 | #165 | Average 11.7% |
| Pakistanis | 54.7 /100 | #166 | Average 11.7% |
| Estonians | 54.4 /100 | #167 | Average 11.7% |
| Immigrants | Latin America | 54.1 /100 | #168 | Average 11.7% |
| Immigrants | Austria | 53.4 /100 | #169 | Average 11.7% |
| Immigrants | Albania | 52.8 /100 | #170 | Average 11.7% |
| Immigrants | Southern Europe | 52.8 /100 | #171 | Average 11.7% |
| Trinidadians and Tobagonians | 52.7 /100 | #172 | Average 11.7% |
| Maltese | 50.6 /100 | #173 | Average 11.7% |
| Albanians | 50.0 /100 | #174 | Average 11.7% |
| Haitians | 48.6 /100 | #175 | Average 11.7% |
| Immigrants | Western Africa | 47.5 /100 | #176 | Average 11.7% |
Demographics Similar to Immigrants from Taiwan by Disability
In terms of disability, the demographic groups most similar to Immigrants from Taiwan are Filipino (9.6%, a difference of 0.080%), Immigrants from India (9.5%, a difference of 1.1%), Thai (9.7%, a difference of 1.1%), Immigrants from Bolivia (9.9%, a difference of 2.7%), and Immigrants from South Central Asia (9.9%, a difference of 3.6%).
| Demographics | Rating | Rank | Disability |
| Immigrants | India | 100.0 /100 | #1 | Exceptional 9.5% |
| Filipinos | 100.0 /100 | #2 | Exceptional 9.6% |
| Immigrants | Taiwan | 100.0 /100 | #3 | Exceptional 9.6% |
| Thais | 100.0 /100 | #4 | Exceptional 9.7% |
| Immigrants | Bolivia | 100.0 /100 | #5 | Exceptional 9.9% |
| Immigrants | South Central Asia | 100.0 /100 | #6 | Exceptional 9.9% |
| Immigrants | Singapore | 100.0 /100 | #7 | Exceptional 10.0% |
| Bolivians | 100.0 /100 | #8 | Exceptional 10.0% |
| Immigrants | Hong Kong | 100.0 /100 | #9 | Exceptional 10.0% |
| Immigrants | China | 100.0 /100 | #10 | Exceptional 10.1% |
| Iranians | 100.0 /100 | #11 | Exceptional 10.1% |
| Immigrants | Israel | 100.0 /100 | #12 | Exceptional 10.1% |
| Immigrants | Eastern Asia | 100.0 /100 | #13 | Exceptional 10.2% |
| Immigrants | Korea | 100.0 /100 | #14 | Exceptional 10.2% |
| Okinawans | 100.0 /100 | #15 | Exceptional 10.3% |