Celtic vs Immigrants from Taiwan Disability
COMPARE
Celtic
Immigrants from Taiwan
Disability
Disability Comparison
Celtics
Immigrants from Taiwan
13.1%
DISABILITY
0.0/ 100
METRIC RATING
294th/ 347
METRIC RANK
9.6%
DISABILITY
100.0/ 100
METRIC RATING
3rd/ 347
METRIC RANK
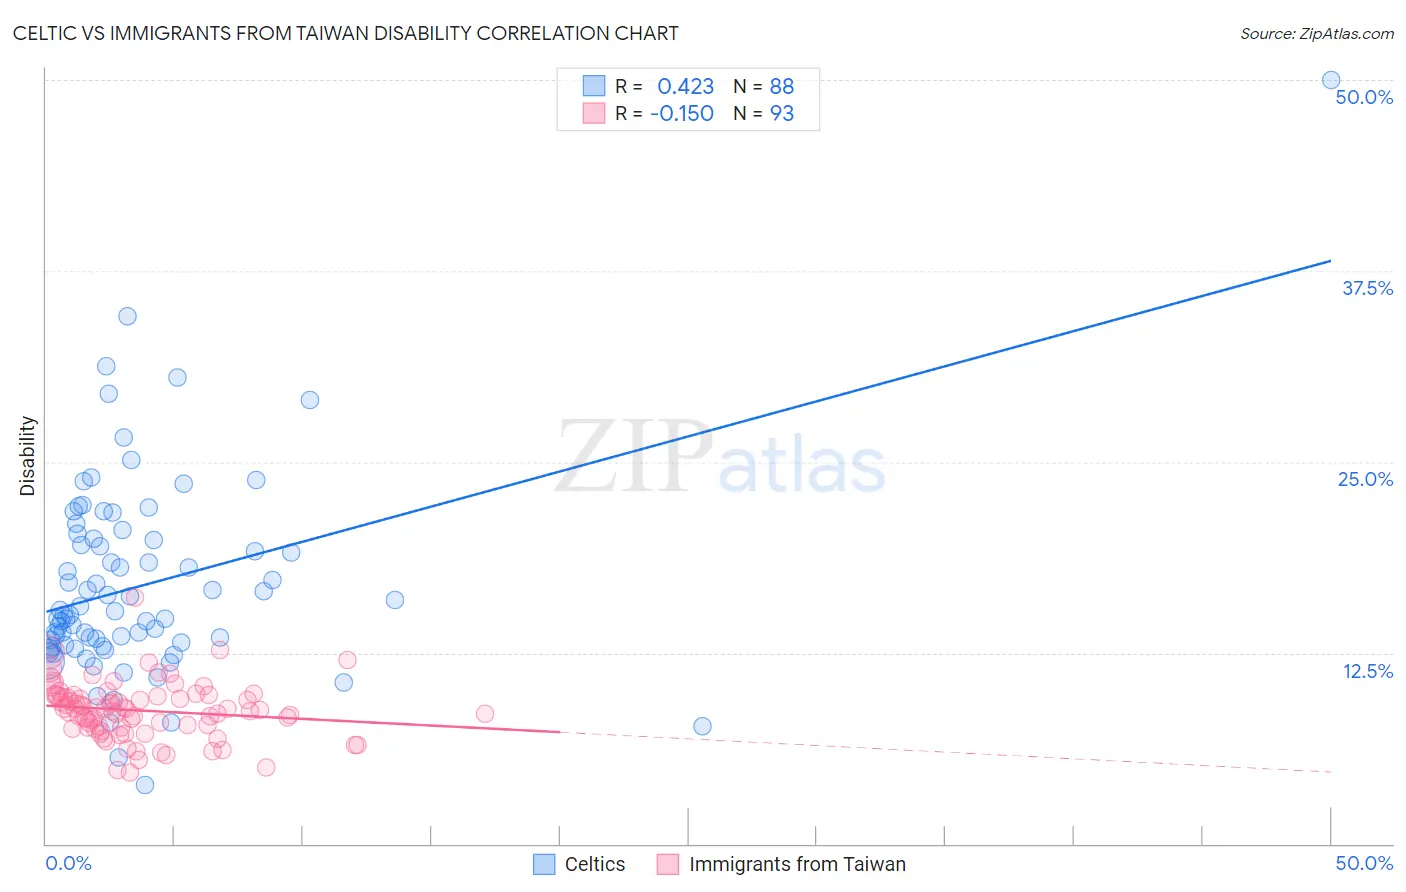
Celtic vs Immigrants from Taiwan Disability Correlation Chart
The statistical analysis conducted on geographies consisting of 168,868,984 people shows a moderate positive correlation between the proportion of Celtics and percentage of population with a disability in the United States with a correlation coefficient (R) of 0.423 and weighted average of 13.1%. Similarly, the statistical analysis conducted on geographies consisting of 298,248,980 people shows a poor negative correlation between the proportion of Immigrants from Taiwan and percentage of population with a disability in the United States with a correlation coefficient (R) of -0.150 and weighted average of 9.6%, a difference of 36.8%.
Disability Correlation Summary
| Measurement | Celtic | Immigrants from Taiwan |
| Minimum | 3.8% | 4.6% |
| Maximum | 50.0% | 16.2% |
| Range | 46.2% | 11.5% |
| Mean | 16.9% | 8.7% |
| Median | 15.1% | 8.8% |
| Interquartile 25% (IQ1) | 13.0% | 7.6% |
| Interquartile 75% (IQ3) | 19.9% | 9.7% |
| Interquartile Range (IQR) | 6.9% | 2.1% |
| Standard Deviation (Sample) | 6.7% | 1.8% |
| Standard Deviation (Population) | 6.7% | 1.8% |
Similar Demographics by Disability
Demographics Similar to Celtics by Disability
In terms of disability, the demographic groups most similar to Celtics are Nonimmigrants (13.2%, a difference of 0.12%), Central American Indian (13.2%, a difference of 0.16%), Hopi (13.2%, a difference of 0.22%), Alaska Native (13.2%, a difference of 0.23%), and French (13.2%, a difference of 0.25%).
| Demographics | Rating | Rank | Disability |
| Africans | 0.0 /100 | #287 | Tragic 13.0% |
| Whites/Caucasians | 0.0 /100 | #288 | Tragic 13.0% |
| Slovaks | 0.0 /100 | #289 | Tragic 13.0% |
| Cheyenne | 0.0 /100 | #290 | Tragic 13.0% |
| Yaqui | 0.0 /100 | #291 | Tragic 13.1% |
| Aleuts | 0.0 /100 | #292 | Tragic 13.1% |
| Marshallese | 0.0 /100 | #293 | Tragic 13.1% |
| Celtics | 0.0 /100 | #294 | Tragic 13.1% |
| Immigrants | Nonimmigrants | 0.0 /100 | #295 | Tragic 13.2% |
| Central American Indians | 0.0 /100 | #296 | Tragic 13.2% |
| Hopi | 0.0 /100 | #297 | Tragic 13.2% |
| Alaska Natives | 0.0 /100 | #298 | Tragic 13.2% |
| French | 0.0 /100 | #299 | Tragic 13.2% |
| Pennsylvania Germans | 0.0 /100 | #300 | Tragic 13.2% |
| Immigrants | Micronesia | 0.0 /100 | #301 | Tragic 13.2% |
Demographics Similar to Immigrants from Taiwan by Disability
In terms of disability, the demographic groups most similar to Immigrants from Taiwan are Filipino (9.6%, a difference of 0.080%), Immigrants from India (9.5%, a difference of 1.1%), Thai (9.7%, a difference of 1.1%), Immigrants from Bolivia (9.9%, a difference of 2.7%), and Immigrants from South Central Asia (9.9%, a difference of 3.6%).
| Demographics | Rating | Rank | Disability |
| Immigrants | India | 100.0 /100 | #1 | Exceptional 9.5% |
| Filipinos | 100.0 /100 | #2 | Exceptional 9.6% |
| Immigrants | Taiwan | 100.0 /100 | #3 | Exceptional 9.6% |
| Thais | 100.0 /100 | #4 | Exceptional 9.7% |
| Immigrants | Bolivia | 100.0 /100 | #5 | Exceptional 9.9% |
| Immigrants | South Central Asia | 100.0 /100 | #6 | Exceptional 9.9% |
| Immigrants | Singapore | 100.0 /100 | #7 | Exceptional 10.0% |
| Bolivians | 100.0 /100 | #8 | Exceptional 10.0% |
| Immigrants | Hong Kong | 100.0 /100 | #9 | Exceptional 10.0% |
| Immigrants | China | 100.0 /100 | #10 | Exceptional 10.1% |
| Iranians | 100.0 /100 | #11 | Exceptional 10.1% |
| Immigrants | Israel | 100.0 /100 | #12 | Exceptional 10.1% |
| Immigrants | Eastern Asia | 100.0 /100 | #13 | Exceptional 10.2% |
| Immigrants | Korea | 100.0 /100 | #14 | Exceptional 10.2% |
| Okinawans | 100.0 /100 | #15 | Exceptional 10.3% |