Swiss vs Immigrants from Taiwan Single Mother Poverty
COMPARE
Swiss
Immigrants from Taiwan
Single Mother Poverty
Single Mother Poverty Comparison
Swiss
Immigrants from Taiwan
29.7%
SINGLE MOTHER POVERTY
17.2/ 100
METRIC RATING
203rd/ 347
METRIC RANK
23.9%
SINGLE MOTHER POVERTY
100.0/ 100
METRIC RATING
3rd/ 347
METRIC RANK
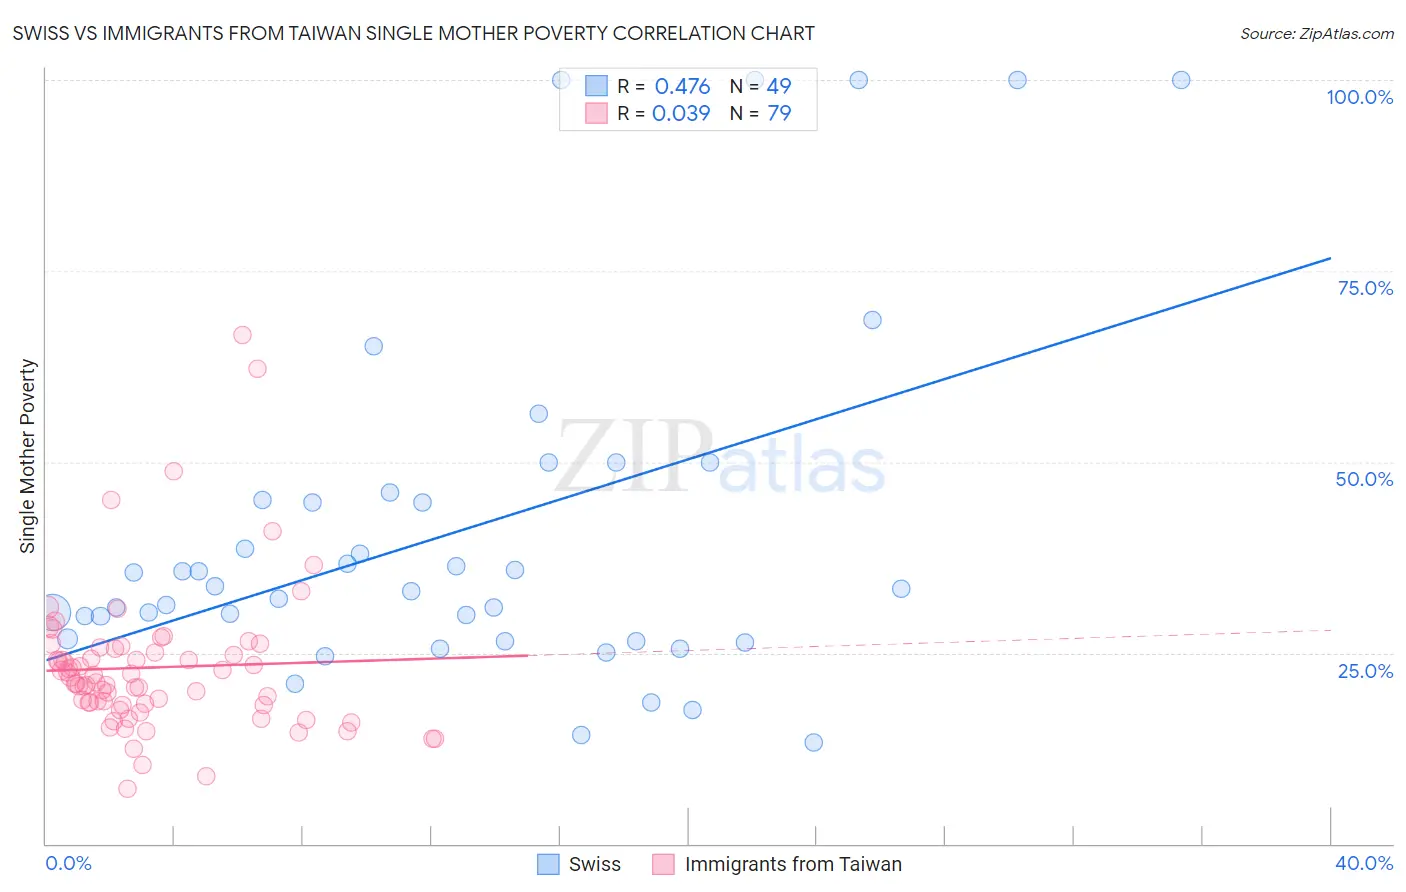
Swiss vs Immigrants from Taiwan Single Mother Poverty Correlation Chart
The statistical analysis conducted on geographies consisting of 448,256,315 people shows a moderate positive correlation between the proportion of Swiss and poverty level among single mothers in the United States with a correlation coefficient (R) of 0.476 and weighted average of 29.7%. Similarly, the statistical analysis conducted on geographies consisting of 291,292,084 people shows no correlation between the proportion of Immigrants from Taiwan and poverty level among single mothers in the United States with a correlation coefficient (R) of 0.039 and weighted average of 23.9%, a difference of 24.6%.
Single Mother Poverty Correlation Summary
| Measurement | Swiss | Immigrants from Taiwan |
| Minimum | 13.3% | 7.2% |
| Maximum | 100.0% | 66.7% |
| Range | 86.7% | 59.4% |
| Mean | 41.0% | 23.1% |
| Median | 33.3% | 21.1% |
| Interquartile 25% (IQ1) | 26.7% | 18.2% |
| Interquartile 75% (IQ3) | 45.5% | 25.5% |
| Interquartile Range (IQR) | 18.8% | 7.3% |
| Standard Deviation (Sample) | 23.1% | 9.7% |
| Standard Deviation (Population) | 22.8% | 9.6% |
Similar Demographics by Single Mother Poverty
Demographics Similar to Swiss by Single Mother Poverty
In terms of single mother poverty, the demographic groups most similar to Swiss are Malaysian (29.7%, a difference of 0.020%), Immigrants (29.7%, a difference of 0.050%), Czechoslovakian (29.7%, a difference of 0.10%), Belgian (29.7%, a difference of 0.12%), and Immigrants from Haiti (29.7%, a difference of 0.12%).
| Demographics | Rating | Rank | Single Mother Poverty |
| Spanish American Indians | 23.4 /100 | #196 | Fair 29.6% |
| Immigrants | Jamaica | 22.0 /100 | #197 | Fair 29.6% |
| Trinidadians and Tobagonians | 21.7 /100 | #198 | Fair 29.6% |
| Cubans | 20.8 /100 | #199 | Fair 29.6% |
| Panamanians | 20.0 /100 | #200 | Fair 29.6% |
| Belgians | 18.8 /100 | #201 | Poor 29.7% |
| Malaysians | 17.4 /100 | #202 | Poor 29.7% |
| Swiss | 17.2 /100 | #203 | Poor 29.7% |
| Immigrants | Immigrants | 16.6 /100 | #204 | Poor 29.7% |
| Czechoslovakians | 16.1 /100 | #205 | Poor 29.7% |
| Immigrants | Haiti | 15.8 /100 | #206 | Poor 29.7% |
| Immigrants | Panama | 15.5 /100 | #207 | Poor 29.8% |
| Immigrants | Guyana | 14.7 /100 | #208 | Poor 29.8% |
| Irish | 13.9 /100 | #209 | Poor 29.8% |
| Haitians | 13.3 /100 | #210 | Poor 29.8% |
Demographics Similar to Immigrants from Taiwan by Single Mother Poverty
In terms of single mother poverty, the demographic groups most similar to Immigrants from Taiwan are Immigrants from India (23.8%, a difference of 0.20%), Assyrian/Chaldean/Syriac (23.8%, a difference of 0.21%), Filipino (24.3%, a difference of 1.9%), Immigrants from Hong Kong (24.4%, a difference of 2.1%), and Thai (24.5%, a difference of 2.7%).
| Demographics | Rating | Rank | Single Mother Poverty |
| Assyrians/Chaldeans/Syriacs | 100.0 /100 | #1 | Exceptional 23.8% |
| Immigrants | India | 100.0 /100 | #2 | Exceptional 23.8% |
| Immigrants | Taiwan | 100.0 /100 | #3 | Exceptional 23.9% |
| Filipinos | 100.0 /100 | #4 | Exceptional 24.3% |
| Immigrants | Hong Kong | 100.0 /100 | #5 | Exceptional 24.4% |
| Thais | 100.0 /100 | #6 | Exceptional 24.5% |
| Chinese | 100.0 /100 | #7 | Exceptional 24.6% |
| Immigrants | Iran | 100.0 /100 | #8 | Exceptional 25.1% |
| Immigrants | Lithuania | 100.0 /100 | #9 | Exceptional 25.2% |
| Immigrants | South Central Asia | 100.0 /100 | #10 | Exceptional 25.3% |
| Iranians | 100.0 /100 | #11 | Exceptional 25.5% |
| Bhutanese | 100.0 /100 | #12 | Exceptional 25.6% |
| Indians (Asian) | 100.0 /100 | #13 | Exceptional 25.8% |
| Immigrants | Singapore | 100.0 /100 | #14 | Exceptional 25.8% |
| Immigrants | Ireland | 100.0 /100 | #15 | Exceptional 25.8% |