Australian vs Immigrants from Taiwan Disability
COMPARE
Australian
Immigrants from Taiwan
Disability
Disability Comparison
Australians
Immigrants from Taiwan
11.5%
DISABILITY
82.5/ 100
METRIC RATING
144th/ 347
METRIC RANK
9.6%
DISABILITY
100.0/ 100
METRIC RATING
3rd/ 347
METRIC RANK
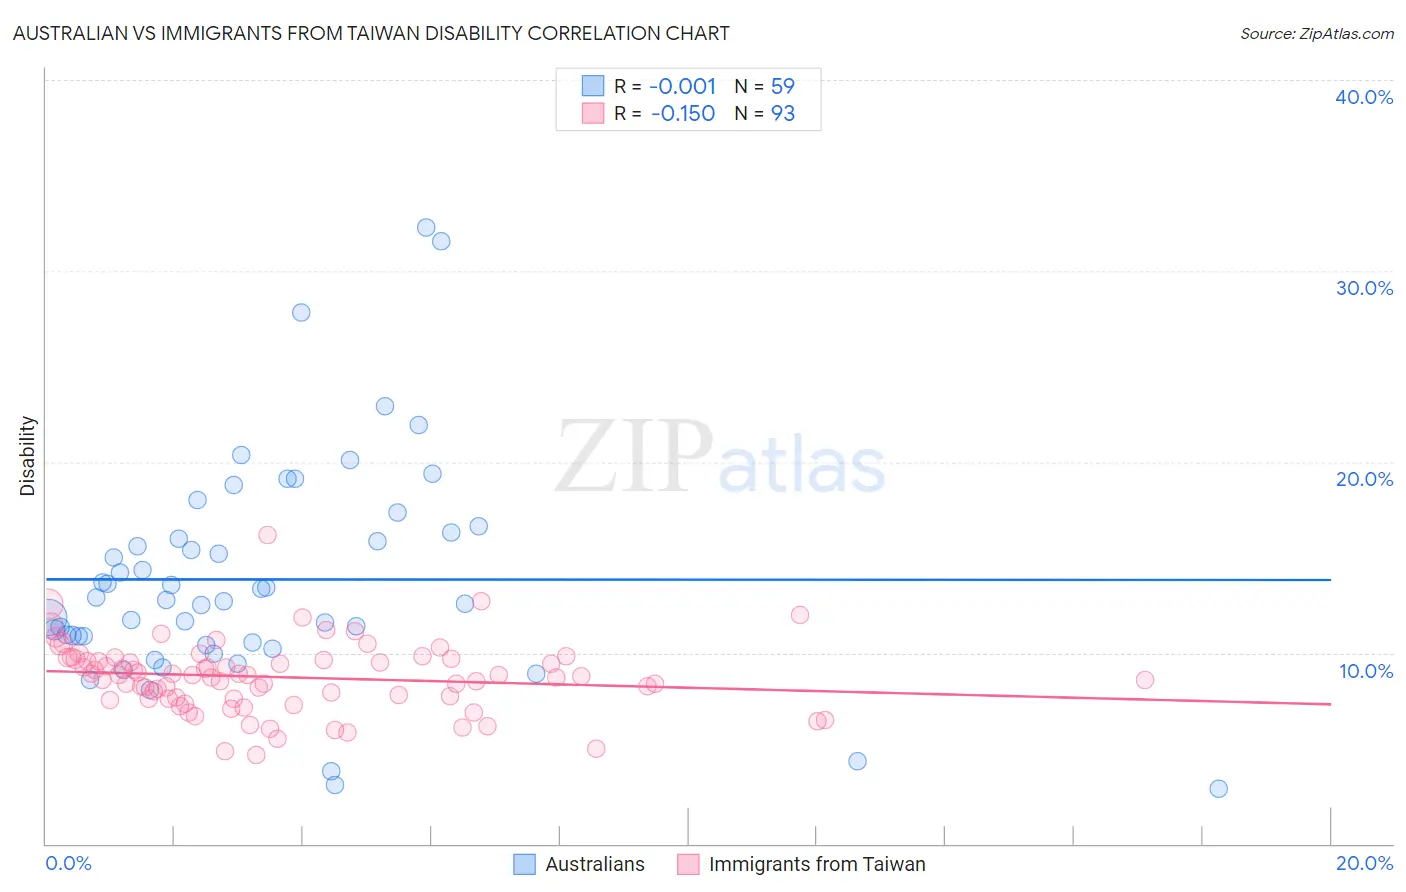
Australian vs Immigrants from Taiwan Disability Correlation Chart
The statistical analysis conducted on geographies consisting of 224,142,596 people shows no correlation between the proportion of Australians and percentage of population with a disability in the United States with a correlation coefficient (R) of -0.001 and weighted average of 11.5%. Similarly, the statistical analysis conducted on geographies consisting of 298,248,980 people shows a poor negative correlation between the proportion of Immigrants from Taiwan and percentage of population with a disability in the United States with a correlation coefficient (R) of -0.150 and weighted average of 9.6%, a difference of 19.7%.
Disability Correlation Summary
| Measurement | Australian | Immigrants from Taiwan |
| Minimum | 2.9% | 4.6% |
| Maximum | 32.3% | 16.2% |
| Range | 29.3% | 11.5% |
| Mean | 13.8% | 8.7% |
| Median | 12.8% | 8.8% |
| Interquartile 25% (IQ1) | 10.6% | 7.6% |
| Interquartile 75% (IQ3) | 16.3% | 9.7% |
| Interquartile Range (IQR) | 5.7% | 2.1% |
| Standard Deviation (Sample) | 5.8% | 1.8% |
| Standard Deviation (Population) | 5.8% | 1.8% |
Similar Demographics by Disability
Demographics Similar to Australians by Disability
In terms of disability, the demographic groups most similar to Australians are Moroccan (11.5%, a difference of 0.070%), Nigerian (11.5%, a difference of 0.090%), Immigrants from Sudan (11.5%, a difference of 0.24%), Immigrants from Hungary (11.5%, a difference of 0.25%), and Immigrants from Grenada (11.5%, a difference of 0.31%).
| Demographics | Rating | Rank | Disability |
| Kenyans | 87.1 /100 | #137 | Excellent 11.5% |
| New Zealanders | 87.0 /100 | #138 | Excellent 11.5% |
| Ghanaians | 87.0 /100 | #139 | Excellent 11.5% |
| Russians | 86.8 /100 | #140 | Excellent 11.5% |
| Immigrants | Grenada | 86.1 /100 | #141 | Excellent 11.5% |
| Immigrants | Sudan | 85.3 /100 | #142 | Excellent 11.5% |
| Moroccans | 83.3 /100 | #143 | Excellent 11.5% |
| Australians | 82.5 /100 | #144 | Excellent 11.5% |
| Nigerians | 81.3 /100 | #145 | Excellent 11.5% |
| Immigrants | Hungary | 79.0 /100 | #146 | Good 11.5% |
| Immigrants | Ukraine | 77.6 /100 | #147 | Good 11.5% |
| Sudanese | 77.1 /100 | #148 | Good 11.5% |
| Immigrants | Norway | 73.2 /100 | #149 | Good 11.6% |
| Romanians | 72.7 /100 | #150 | Good 11.6% |
| Immigrants | Kenya | 72.1 /100 | #151 | Good 11.6% |
Demographics Similar to Immigrants from Taiwan by Disability
In terms of disability, the demographic groups most similar to Immigrants from Taiwan are Filipino (9.6%, a difference of 0.080%), Immigrants from India (9.5%, a difference of 1.1%), Thai (9.7%, a difference of 1.1%), Immigrants from Bolivia (9.9%, a difference of 2.7%), and Immigrants from South Central Asia (9.9%, a difference of 3.6%).
| Demographics | Rating | Rank | Disability |
| Immigrants | India | 100.0 /100 | #1 | Exceptional 9.5% |
| Filipinos | 100.0 /100 | #2 | Exceptional 9.6% |
| Immigrants | Taiwan | 100.0 /100 | #3 | Exceptional 9.6% |
| Thais | 100.0 /100 | #4 | Exceptional 9.7% |
| Immigrants | Bolivia | 100.0 /100 | #5 | Exceptional 9.9% |
| Immigrants | South Central Asia | 100.0 /100 | #6 | Exceptional 9.9% |
| Immigrants | Singapore | 100.0 /100 | #7 | Exceptional 10.0% |
| Bolivians | 100.0 /100 | #8 | Exceptional 10.0% |
| Immigrants | Hong Kong | 100.0 /100 | #9 | Exceptional 10.0% |
| Immigrants | China | 100.0 /100 | #10 | Exceptional 10.1% |
| Iranians | 100.0 /100 | #11 | Exceptional 10.1% |
| Immigrants | Israel | 100.0 /100 | #12 | Exceptional 10.1% |
| Immigrants | Eastern Asia | 100.0 /100 | #13 | Exceptional 10.2% |
| Immigrants | Korea | 100.0 /100 | #14 | Exceptional 10.2% |
| Okinawans | 100.0 /100 | #15 | Exceptional 10.3% |