Immigrants from Philippines vs Immigrants from Taiwan Disability
COMPARE
Immigrants from Philippines
Immigrants from Taiwan
Disability
Disability Comparison
Immigrants from Philippines
Immigrants from Taiwan
11.3%
DISABILITY
94.6/ 100
METRIC RATING
115th/ 347
METRIC RANK
9.6%
DISABILITY
100.0/ 100
METRIC RATING
3rd/ 347
METRIC RANK
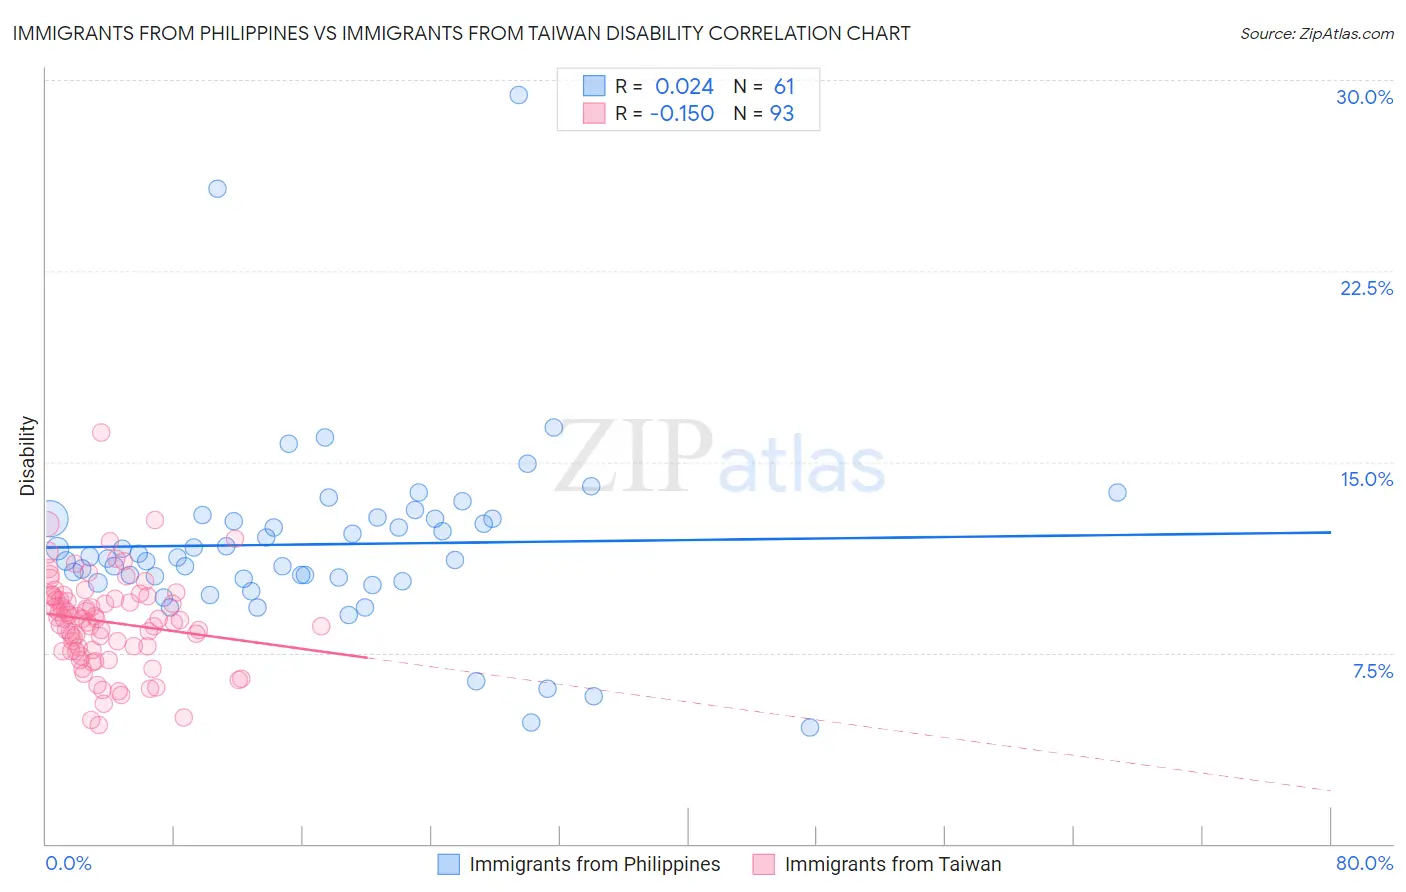
Immigrants from Philippines vs Immigrants from Taiwan Disability Correlation Chart
The statistical analysis conducted on geographies consisting of 471,195,487 people shows no correlation between the proportion of Immigrants from Philippines and percentage of population with a disability in the United States with a correlation coefficient (R) of 0.024 and weighted average of 11.3%. Similarly, the statistical analysis conducted on geographies consisting of 298,248,980 people shows a poor negative correlation between the proportion of Immigrants from Taiwan and percentage of population with a disability in the United States with a correlation coefficient (R) of -0.150 and weighted average of 9.6%, a difference of 18.0%.
Disability Correlation Summary
| Measurement | Immigrants from Philippines | Immigrants from Taiwan |
| Minimum | 4.6% | 4.6% |
| Maximum | 29.4% | 16.2% |
| Range | 24.8% | 11.5% |
| Mean | 11.8% | 8.7% |
| Median | 11.3% | 8.8% |
| Interquartile 25% (IQ1) | 10.4% | 7.6% |
| Interquartile 75% (IQ3) | 12.8% | 9.7% |
| Interquartile Range (IQR) | 2.4% | 2.1% |
| Standard Deviation (Sample) | 3.8% | 1.8% |
| Standard Deviation (Population) | 3.8% | 1.8% |
Similar Demographics by Disability
Demographics Similar to Immigrants from Philippines by Disability
In terms of disability, the demographic groups most similar to Immigrants from Philippines are Immigrants from Syria (11.3%, a difference of 0.010%), Guyanese (11.3%, a difference of 0.020%), Immigrants from Uzbekistan (11.3%, a difference of 0.060%), Immigrants from Northern Europe (11.3%, a difference of 0.11%), and Luxembourger (11.3%, a difference of 0.17%).
| Demographics | Rating | Rank | Disability |
| Immigrants | Nigeria | 96.0 /100 | #108 | Exceptional 11.3% |
| Immigrants | Uganda | 95.7 /100 | #109 | Exceptional 11.3% |
| Immigrants | Denmark | 95.6 /100 | #110 | Exceptional 11.3% |
| Immigrants | South Eastern Asia | 95.4 /100 | #111 | Exceptional 11.3% |
| Immigrants | Uzbekistan | 94.9 /100 | #112 | Exceptional 11.3% |
| Guyanese | 94.7 /100 | #113 | Exceptional 11.3% |
| Immigrants | Syria | 94.7 /100 | #114 | Exceptional 11.3% |
| Immigrants | Philippines | 94.6 /100 | #115 | Exceptional 11.3% |
| Immigrants | Northern Europe | 94.1 /100 | #116 | Exceptional 11.3% |
| Luxembourgers | 93.9 /100 | #117 | Exceptional 11.3% |
| Koreans | 93.8 /100 | #118 | Exceptional 11.3% |
| Central Americans | 93.5 /100 | #119 | Exceptional 11.4% |
| Immigrants | North Macedonia | 93.5 /100 | #120 | Exceptional 11.4% |
| Immigrants | Costa Rica | 93.4 /100 | #121 | Exceptional 11.4% |
| Brazilians | 93.3 /100 | #122 | Exceptional 11.4% |
Demographics Similar to Immigrants from Taiwan by Disability
In terms of disability, the demographic groups most similar to Immigrants from Taiwan are Filipino (9.6%, a difference of 0.080%), Immigrants from India (9.5%, a difference of 1.1%), Thai (9.7%, a difference of 1.1%), Immigrants from Bolivia (9.9%, a difference of 2.7%), and Immigrants from South Central Asia (9.9%, a difference of 3.6%).
| Demographics | Rating | Rank | Disability |
| Immigrants | India | 100.0 /100 | #1 | Exceptional 9.5% |
| Filipinos | 100.0 /100 | #2 | Exceptional 9.6% |
| Immigrants | Taiwan | 100.0 /100 | #3 | Exceptional 9.6% |
| Thais | 100.0 /100 | #4 | Exceptional 9.7% |
| Immigrants | Bolivia | 100.0 /100 | #5 | Exceptional 9.9% |
| Immigrants | South Central Asia | 100.0 /100 | #6 | Exceptional 9.9% |
| Immigrants | Singapore | 100.0 /100 | #7 | Exceptional 10.0% |
| Bolivians | 100.0 /100 | #8 | Exceptional 10.0% |
| Immigrants | Hong Kong | 100.0 /100 | #9 | Exceptional 10.0% |
| Immigrants | China | 100.0 /100 | #10 | Exceptional 10.1% |
| Iranians | 100.0 /100 | #11 | Exceptional 10.1% |
| Immigrants | Israel | 100.0 /100 | #12 | Exceptional 10.1% |
| Immigrants | Eastern Asia | 100.0 /100 | #13 | Exceptional 10.2% |
| Immigrants | Korea | 100.0 /100 | #14 | Exceptional 10.2% |
| Okinawans | 100.0 /100 | #15 | Exceptional 10.3% |