Immigrants from Senegal vs Immigrants from Taiwan Disability
COMPARE
Immigrants from Senegal
Immigrants from Taiwan
Disability
Disability Comparison
Immigrants from Senegal
Immigrants from Taiwan
12.0%
DISABILITY
9.4/ 100
METRIC RATING
206th/ 347
METRIC RANK
9.6%
DISABILITY
100.0/ 100
METRIC RATING
3rd/ 347
METRIC RANK
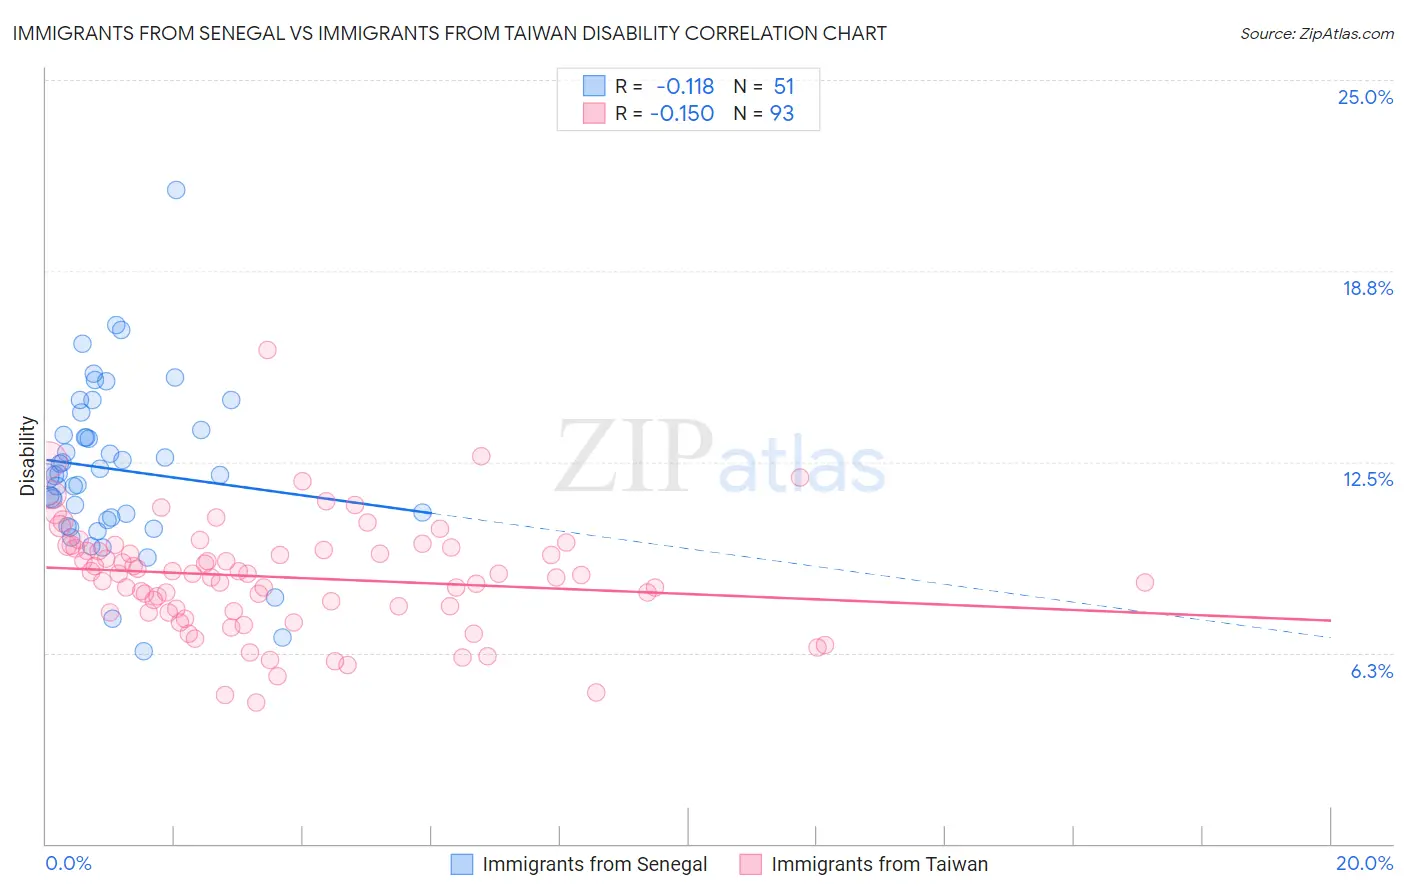
Immigrants from Senegal vs Immigrants from Taiwan Disability Correlation Chart
The statistical analysis conducted on geographies consisting of 90,129,421 people shows a poor negative correlation between the proportion of Immigrants from Senegal and percentage of population with a disability in the United States with a correlation coefficient (R) of -0.118 and weighted average of 12.0%. Similarly, the statistical analysis conducted on geographies consisting of 298,248,980 people shows a poor negative correlation between the proportion of Immigrants from Taiwan and percentage of population with a disability in the United States with a correlation coefficient (R) of -0.150 and weighted average of 9.6%, a difference of 24.9%.
Disability Correlation Summary
| Measurement | Immigrants from Senegal | Immigrants from Taiwan |
| Minimum | 6.3% | 4.6% |
| Maximum | 21.4% | 16.2% |
| Range | 15.1% | 11.5% |
| Mean | 12.3% | 8.7% |
| Median | 12.1% | 8.8% |
| Interquartile 25% (IQ1) | 10.6% | 7.6% |
| Interquartile 75% (IQ3) | 13.6% | 9.7% |
| Interquartile Range (IQR) | 3.0% | 2.1% |
| Standard Deviation (Sample) | 2.7% | 1.8% |
| Standard Deviation (Population) | 2.7% | 1.8% |
Similar Demographics by Disability
Demographics Similar to Immigrants from Senegal by Disability
In terms of disability, the demographic groups most similar to Immigrants from Senegal are Immigrants from Thailand (12.0%, a difference of 0.010%), Immigrants from Caribbean (12.0%, a difference of 0.040%), Immigrants from Western Europe (12.0%, a difference of 0.080%), Danish (12.0%, a difference of 0.080%), and Czech (12.0%, a difference of 0.21%).
| Demographics | Rating | Rank | Disability |
| Immigrants | Panama | 14.6 /100 | #199 | Poor 11.9% |
| Belizeans | 12.8 /100 | #200 | Poor 11.9% |
| Assyrians/Chaldeans/Syriacs | 12.6 /100 | #201 | Poor 11.9% |
| Immigrants | England | 12.0 /100 | #202 | Poor 12.0% |
| British West Indians | 11.5 /100 | #203 | Poor 12.0% |
| Mexican American Indians | 11.4 /100 | #204 | Poor 12.0% |
| Immigrants | Western Europe | 10.1 /100 | #205 | Poor 12.0% |
| Immigrants | Senegal | 9.4 /100 | #206 | Tragic 12.0% |
| Immigrants | Thailand | 9.3 /100 | #207 | Tragic 12.0% |
| Immigrants | Caribbean | 9.1 /100 | #208 | Tragic 12.0% |
| Danes | 8.7 /100 | #209 | Tragic 12.0% |
| Czechs | 7.9 /100 | #210 | Tragic 12.0% |
| Immigrants | Cambodia | 7.3 /100 | #211 | Tragic 12.0% |
| Austrians | 7.2 /100 | #212 | Tragic 12.0% |
| Immigrants | Iraq | 7.1 /100 | #213 | Tragic 12.0% |
Demographics Similar to Immigrants from Taiwan by Disability
In terms of disability, the demographic groups most similar to Immigrants from Taiwan are Filipino (9.6%, a difference of 0.080%), Immigrants from India (9.5%, a difference of 1.1%), Thai (9.7%, a difference of 1.1%), Immigrants from Bolivia (9.9%, a difference of 2.7%), and Immigrants from South Central Asia (9.9%, a difference of 3.6%).
| Demographics | Rating | Rank | Disability |
| Immigrants | India | 100.0 /100 | #1 | Exceptional 9.5% |
| Filipinos | 100.0 /100 | #2 | Exceptional 9.6% |
| Immigrants | Taiwan | 100.0 /100 | #3 | Exceptional 9.6% |
| Thais | 100.0 /100 | #4 | Exceptional 9.7% |
| Immigrants | Bolivia | 100.0 /100 | #5 | Exceptional 9.9% |
| Immigrants | South Central Asia | 100.0 /100 | #6 | Exceptional 9.9% |
| Immigrants | Singapore | 100.0 /100 | #7 | Exceptional 10.0% |
| Bolivians | 100.0 /100 | #8 | Exceptional 10.0% |
| Immigrants | Hong Kong | 100.0 /100 | #9 | Exceptional 10.0% |
| Immigrants | China | 100.0 /100 | #10 | Exceptional 10.1% |
| Iranians | 100.0 /100 | #11 | Exceptional 10.1% |
| Immigrants | Israel | 100.0 /100 | #12 | Exceptional 10.1% |
| Immigrants | Eastern Asia | 100.0 /100 | #13 | Exceptional 10.2% |
| Immigrants | Korea | 100.0 /100 | #14 | Exceptional 10.2% |
| Okinawans | 100.0 /100 | #15 | Exceptional 10.3% |