Subsaharan African vs Czechoslovakian Disability Age 65 to 74
COMPARE
Subsaharan African
Czechoslovakian
Disability Age 65 to 74
Disability Age 65 to 74 Comparison
Sub-Saharan Africans
Czechoslovakians
25.1%
DISABILITY AGE 65 TO 74
0.6/ 100
METRIC RATING
253rd/ 347
METRIC RANK
23.0%
DISABILITY AGE 65 TO 74
72.4/ 100
METRIC RATING
157th/ 347
METRIC RANK
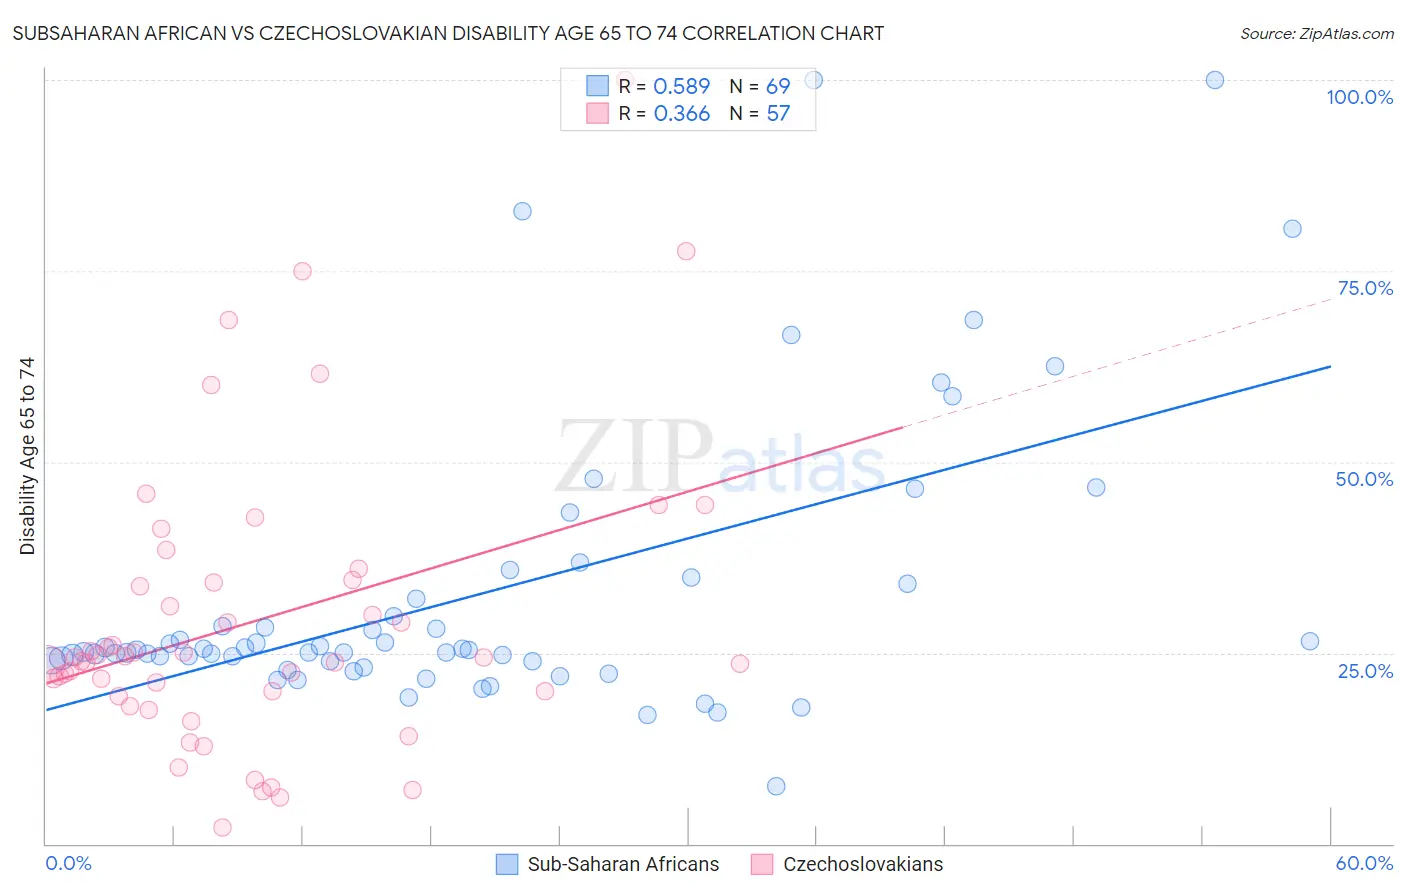
Subsaharan African vs Czechoslovakian Disability Age 65 to 74 Correlation Chart
The statistical analysis conducted on geographies consisting of 506,486,159 people shows a substantial positive correlation between the proportion of Sub-Saharan Africans and percentage of population with a disability between the ages 65 and 75 in the United States with a correlation coefficient (R) of 0.589 and weighted average of 25.1%. Similarly, the statistical analysis conducted on geographies consisting of 368,238,154 people shows a mild positive correlation between the proportion of Czechoslovakians and percentage of population with a disability between the ages 65 and 75 in the United States with a correlation coefficient (R) of 0.366 and weighted average of 23.0%, a difference of 9.0%.
Disability Age 65 to 74 Correlation Summary
| Measurement | Subsaharan African | Czechoslovakian |
| Minimum | 7.5% | 2.1% |
| Maximum | 100.0% | 100.0% |
| Range | 92.5% | 97.9% |
| Mean | 32.6% | 29.0% |
| Median | 25.4% | 24.3% |
| Interquartile 25% (IQ1) | 23.9% | 19.6% |
| Interquartile 75% (IQ3) | 33.0% | 34.3% |
| Interquartile Range (IQR) | 9.1% | 14.7% |
| Standard Deviation (Sample) | 18.8% | 18.9% |
| Standard Deviation (Population) | 18.7% | 18.7% |
Similar Demographics by Disability Age 65 to 74
Demographics Similar to Sub-Saharan Africans by Disability Age 65 to 74
In terms of disability age 65 to 74, the demographic groups most similar to Sub-Saharan Africans are Immigrants from El Salvador (25.1%, a difference of 0.030%), Somali (25.1%, a difference of 0.080%), Nonimmigrants (25.0%, a difference of 0.23%), Central American (25.1%, a difference of 0.23%), and Salvadoran (25.0%, a difference of 0.43%).
| Demographics | Rating | Rank | Disability Age 65 to 74 |
| Immigrants | Iraq | 1.9 /100 | #246 | Tragic 24.7% |
| Indonesians | 1.1 /100 | #247 | Tragic 24.9% |
| Senegalese | 0.9 /100 | #248 | Tragic 24.9% |
| Immigrants | Fiji | 0.8 /100 | #249 | Tragic 25.0% |
| Salvadorans | 0.8 /100 | #250 | Tragic 25.0% |
| Immigrants | Nonimmigrants | 0.7 /100 | #251 | Tragic 25.0% |
| Immigrants | El Salvador | 0.6 /100 | #252 | Tragic 25.1% |
| Sub-Saharan Africans | 0.6 /100 | #253 | Tragic 25.1% |
| Somalis | 0.6 /100 | #254 | Tragic 25.1% |
| Central Americans | 0.5 /100 | #255 | Tragic 25.1% |
| Immigrants | Somalia | 0.4 /100 | #256 | Tragic 25.2% |
| Guamanians/Chamorros | 0.3 /100 | #257 | Tragic 25.3% |
| Marshallese | 0.3 /100 | #258 | Tragic 25.3% |
| Immigrants | Cambodia | 0.3 /100 | #259 | Tragic 25.3% |
| Malaysians | 0.2 /100 | #260 | Tragic 25.4% |
Demographics Similar to Czechoslovakians by Disability Age 65 to 74
In terms of disability age 65 to 74, the demographic groups most similar to Czechoslovakians are British (23.0%, a difference of 0.11%), Immigrants from Western Asia (23.0%, a difference of 0.11%), Sri Lankan (23.0%, a difference of 0.12%), Slavic (23.0%, a difference of 0.21%), and Immigrants from Vietnam (23.1%, a difference of 0.23%).
| Demographics | Rating | Rank | Disability Age 65 to 74 |
| Canadians | 77.7 /100 | #150 | Good 22.9% |
| Immigrants | Morocco | 77.6 /100 | #151 | Good 22.9% |
| Finns | 76.5 /100 | #152 | Good 22.9% |
| Slavs | 75.2 /100 | #153 | Good 23.0% |
| Sri Lankans | 74.0 /100 | #154 | Good 23.0% |
| British | 73.9 /100 | #155 | Good 23.0% |
| Immigrants | Western Asia | 73.8 /100 | #156 | Good 23.0% |
| Czechoslovakians | 72.4 /100 | #157 | Good 23.0% |
| Immigrants | Vietnam | 69.1 /100 | #158 | Good 23.1% |
| South American Indians | 65.5 /100 | #159 | Good 23.1% |
| Koreans | 64.2 /100 | #160 | Good 23.1% |
| Immigrants | Cameroon | 63.8 /100 | #161 | Good 23.1% |
| Europeans | 61.2 /100 | #162 | Good 23.2% |
| Immigrants | Philippines | 61.1 /100 | #163 | Good 23.2% |
| Sierra Leoneans | 60.9 /100 | #164 | Good 23.2% |