Subsaharan African vs Ecuadorian Disability Age 65 to 74
COMPARE
Subsaharan African
Ecuadorian
Disability Age 65 to 74
Disability Age 65 to 74 Comparison
Sub-Saharan Africans
Ecuadorians
25.1%
DISABILITY AGE 65 TO 74
0.6/ 100
METRIC RATING
253rd/ 347
METRIC RANK
23.6%
DISABILITY AGE 65 TO 74
29.7/ 100
METRIC RATING
192nd/ 347
METRIC RANK
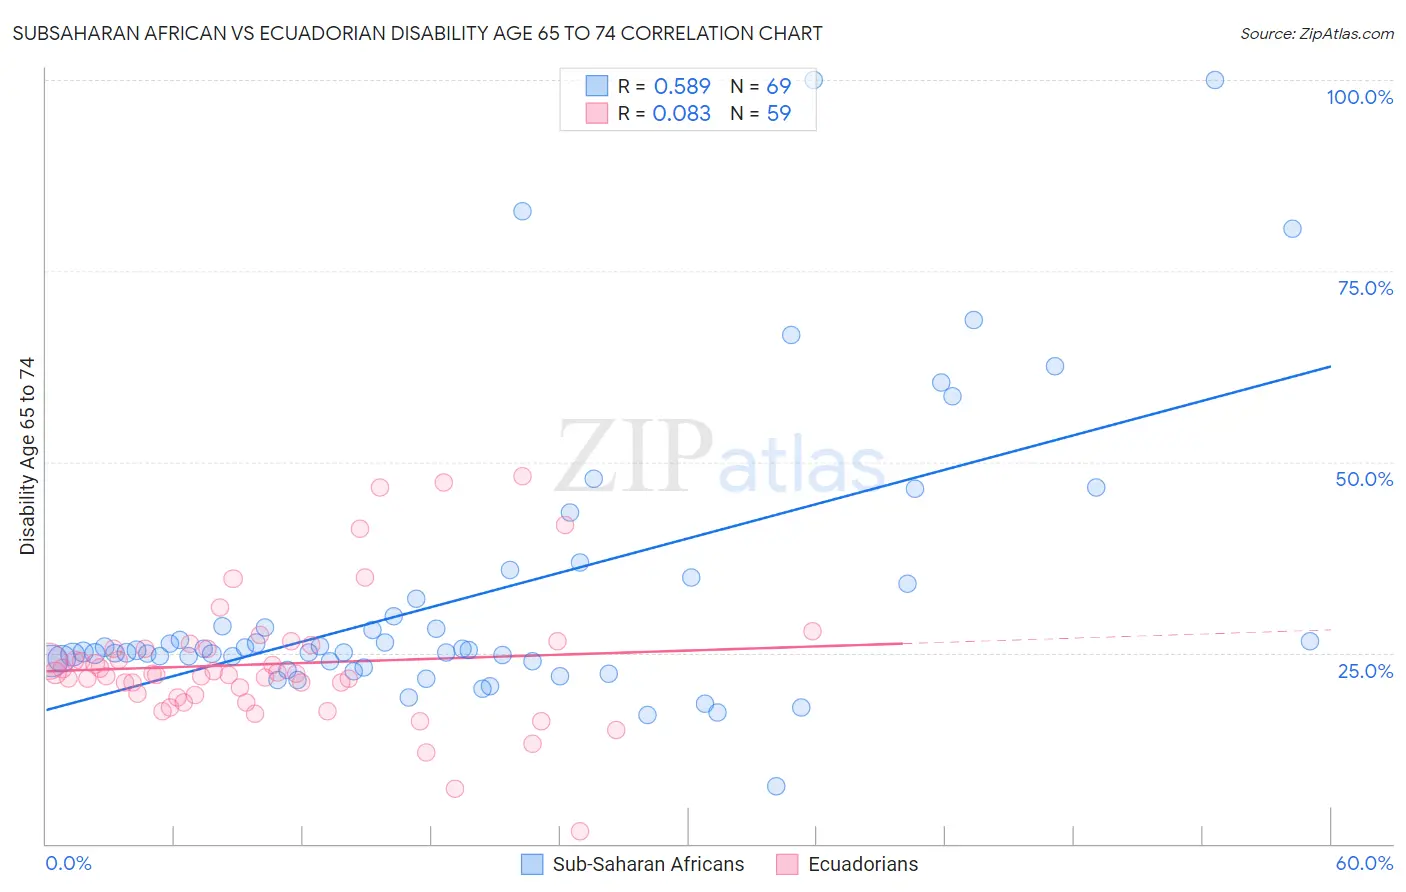
Subsaharan African vs Ecuadorian Disability Age 65 to 74 Correlation Chart
The statistical analysis conducted on geographies consisting of 506,486,159 people shows a substantial positive correlation between the proportion of Sub-Saharan Africans and percentage of population with a disability between the ages 65 and 75 in the United States with a correlation coefficient (R) of 0.589 and weighted average of 25.1%. Similarly, the statistical analysis conducted on geographies consisting of 317,118,668 people shows a slight positive correlation between the proportion of Ecuadorians and percentage of population with a disability between the ages 65 and 75 in the United States with a correlation coefficient (R) of 0.083 and weighted average of 23.6%, a difference of 6.1%.
Disability Age 65 to 74 Correlation Summary
| Measurement | Subsaharan African | Ecuadorian |
| Minimum | 7.5% | 1.6% |
| Maximum | 100.0% | 48.2% |
| Range | 92.5% | 46.6% |
| Mean | 32.6% | 23.5% |
| Median | 25.4% | 22.2% |
| Interquartile 25% (IQ1) | 23.9% | 19.5% |
| Interquartile 75% (IQ3) | 33.0% | 25.6% |
| Interquartile Range (IQR) | 9.1% | 6.1% |
| Standard Deviation (Sample) | 18.8% | 8.5% |
| Standard Deviation (Population) | 18.7% | 8.5% |
Similar Demographics by Disability Age 65 to 74
Demographics Similar to Sub-Saharan Africans by Disability Age 65 to 74
In terms of disability age 65 to 74, the demographic groups most similar to Sub-Saharan Africans are Immigrants from El Salvador (25.1%, a difference of 0.030%), Somali (25.1%, a difference of 0.080%), Nonimmigrants (25.0%, a difference of 0.23%), Central American (25.1%, a difference of 0.23%), and Salvadoran (25.0%, a difference of 0.43%).
| Demographics | Rating | Rank | Disability Age 65 to 74 |
| Immigrants | Iraq | 1.9 /100 | #246 | Tragic 24.7% |
| Indonesians | 1.1 /100 | #247 | Tragic 24.9% |
| Senegalese | 0.9 /100 | #248 | Tragic 24.9% |
| Immigrants | Fiji | 0.8 /100 | #249 | Tragic 25.0% |
| Salvadorans | 0.8 /100 | #250 | Tragic 25.0% |
| Immigrants | Nonimmigrants | 0.7 /100 | #251 | Tragic 25.0% |
| Immigrants | El Salvador | 0.6 /100 | #252 | Tragic 25.1% |
| Sub-Saharan Africans | 0.6 /100 | #253 | Tragic 25.1% |
| Somalis | 0.6 /100 | #254 | Tragic 25.1% |
| Central Americans | 0.5 /100 | #255 | Tragic 25.1% |
| Immigrants | Somalia | 0.4 /100 | #256 | Tragic 25.2% |
| Guamanians/Chamorros | 0.3 /100 | #257 | Tragic 25.3% |
| Marshallese | 0.3 /100 | #258 | Tragic 25.3% |
| Immigrants | Cambodia | 0.3 /100 | #259 | Tragic 25.3% |
| Malaysians | 0.2 /100 | #260 | Tragic 25.4% |
Demographics Similar to Ecuadorians by Disability Age 65 to 74
In terms of disability age 65 to 74, the demographic groups most similar to Ecuadorians are Immigrants from Bangladesh (23.6%, a difference of 0.030%), English (23.6%, a difference of 0.080%), Immigrants from Guyana (23.6%, a difference of 0.10%), Sudanese (23.7%, a difference of 0.13%), and Scottish (23.6%, a difference of 0.23%).
| Demographics | Rating | Rank | Disability Age 65 to 74 |
| Haitians | 42.4 /100 | #185 | Average 23.4% |
| Basques | 38.4 /100 | #186 | Fair 23.5% |
| Portuguese | 37.8 /100 | #187 | Fair 23.5% |
| Immigrants | Cuba | 34.0 /100 | #188 | Fair 23.6% |
| Scottish | 33.1 /100 | #189 | Fair 23.6% |
| Immigrants | Guyana | 31.2 /100 | #190 | Fair 23.6% |
| Immigrants | Bangladesh | 30.2 /100 | #191 | Fair 23.6% |
| Ecuadorians | 29.7 /100 | #192 | Fair 23.6% |
| English | 28.5 /100 | #193 | Fair 23.6% |
| Sudanese | 27.8 /100 | #194 | Fair 23.7% |
| Immigrants | St. Vincent and the Grenadines | 26.1 /100 | #195 | Fair 23.7% |
| Immigrants | Trinidad and Tobago | 26.1 /100 | #196 | Fair 23.7% |
| Immigrants | Immigrants | 25.8 /100 | #197 | Fair 23.7% |
| Immigrants | Africa | 24.4 /100 | #198 | Fair 23.7% |
| Welsh | 24.3 /100 | #199 | Fair 23.7% |