Aleut vs Czechoslovakian Disability Age 65 to 74
COMPARE
Aleut
Czechoslovakian
Disability Age 65 to 74
Disability Age 65 to 74 Comparison
Aleuts
Czechoslovakians
28.4%
DISABILITY AGE 65 TO 74
0.0/ 100
METRIC RATING
322nd/ 347
METRIC RANK
23.0%
DISABILITY AGE 65 TO 74
72.4/ 100
METRIC RATING
157th/ 347
METRIC RANK
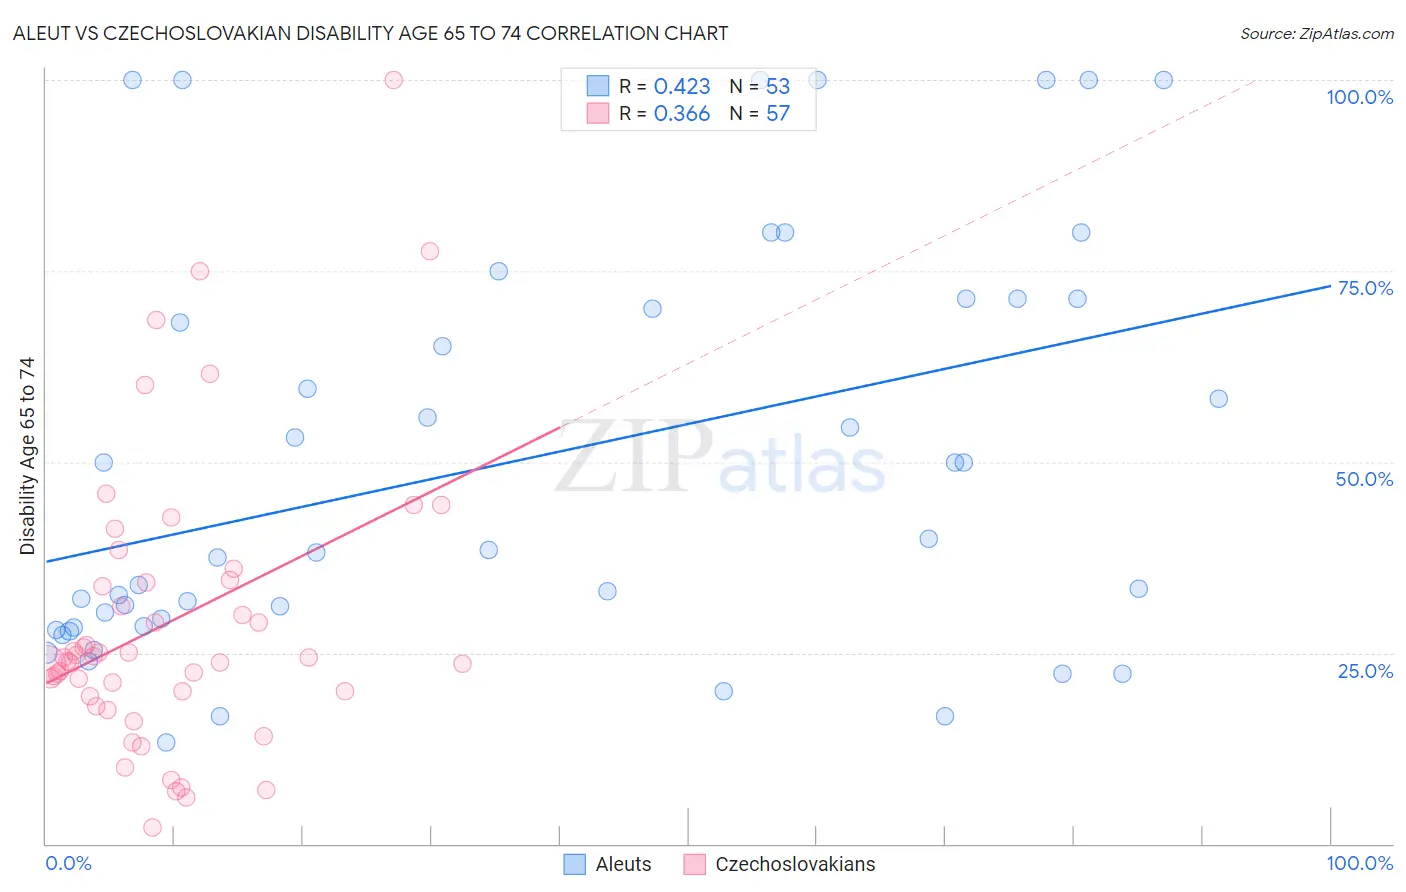
Aleut vs Czechoslovakian Disability Age 65 to 74 Correlation Chart
The statistical analysis conducted on geographies consisting of 61,757,238 people shows a moderate positive correlation between the proportion of Aleuts and percentage of population with a disability between the ages 65 and 75 in the United States with a correlation coefficient (R) of 0.423 and weighted average of 28.4%. Similarly, the statistical analysis conducted on geographies consisting of 368,238,154 people shows a mild positive correlation between the proportion of Czechoslovakians and percentage of population with a disability between the ages 65 and 75 in the United States with a correlation coefficient (R) of 0.366 and weighted average of 23.0%, a difference of 23.6%.
Disability Age 65 to 74 Correlation Summary
| Measurement | Aleut | Czechoslovakian |
| Minimum | 13.2% | 2.1% |
| Maximum | 100.0% | 100.0% |
| Range | 86.8% | 97.9% |
| Mean | 50.2% | 29.0% |
| Median | 38.5% | 24.3% |
| Interquartile 25% (IQ1) | 28.4% | 19.6% |
| Interquartile 75% (IQ3) | 71.4% | 34.3% |
| Interquartile Range (IQR) | 43.0% | 14.7% |
| Standard Deviation (Sample) | 26.9% | 18.9% |
| Standard Deviation (Population) | 26.6% | 18.7% |
Similar Demographics by Disability Age 65 to 74
Demographics Similar to Aleuts by Disability Age 65 to 74
In terms of disability age 65 to 74, the demographic groups most similar to Aleuts are Comanche (28.3%, a difference of 0.33%), Cherokee (28.2%, a difference of 0.84%), Arapaho (28.1%, a difference of 1.2%), Nepalese (28.0%, a difference of 1.5%), and Immigrants from Armenia (28.0%, a difference of 1.7%).
| Demographics | Rating | Rank | Disability Age 65 to 74 |
| Cajuns | 0.0 /100 | #315 | Tragic 27.9% |
| Crow | 0.0 /100 | #316 | Tragic 27.9% |
| Immigrants | Armenia | 0.0 /100 | #317 | Tragic 28.0% |
| Nepalese | 0.0 /100 | #318 | Tragic 28.0% |
| Arapaho | 0.0 /100 | #319 | Tragic 28.1% |
| Cherokee | 0.0 /100 | #320 | Tragic 28.2% |
| Comanche | 0.0 /100 | #321 | Tragic 28.3% |
| Aleuts | 0.0 /100 | #322 | Tragic 28.4% |
| Puerto Ricans | 0.0 /100 | #323 | Tragic 29.1% |
| Seminole | 0.0 /100 | #324 | Tragic 29.4% |
| Dutch West Indians | 0.0 /100 | #325 | Tragic 29.6% |
| Yakama | 0.0 /100 | #326 | Tragic 29.6% |
| Apache | 0.0 /100 | #327 | Tragic 29.7% |
| Hopi | 0.0 /100 | #328 | Tragic 30.0% |
| Choctaw | 0.0 /100 | #329 | Tragic 30.2% |
Demographics Similar to Czechoslovakians by Disability Age 65 to 74
In terms of disability age 65 to 74, the demographic groups most similar to Czechoslovakians are British (23.0%, a difference of 0.11%), Immigrants from Western Asia (23.0%, a difference of 0.11%), Sri Lankan (23.0%, a difference of 0.12%), Slavic (23.0%, a difference of 0.21%), and Immigrants from Vietnam (23.1%, a difference of 0.23%).
| Demographics | Rating | Rank | Disability Age 65 to 74 |
| Canadians | 77.7 /100 | #150 | Good 22.9% |
| Immigrants | Morocco | 77.6 /100 | #151 | Good 22.9% |
| Finns | 76.5 /100 | #152 | Good 22.9% |
| Slavs | 75.2 /100 | #153 | Good 23.0% |
| Sri Lankans | 74.0 /100 | #154 | Good 23.0% |
| British | 73.9 /100 | #155 | Good 23.0% |
| Immigrants | Western Asia | 73.8 /100 | #156 | Good 23.0% |
| Czechoslovakians | 72.4 /100 | #157 | Good 23.0% |
| Immigrants | Vietnam | 69.1 /100 | #158 | Good 23.1% |
| South American Indians | 65.5 /100 | #159 | Good 23.1% |
| Koreans | 64.2 /100 | #160 | Good 23.1% |
| Immigrants | Cameroon | 63.8 /100 | #161 | Good 23.1% |
| Europeans | 61.2 /100 | #162 | Good 23.2% |
| Immigrants | Philippines | 61.1 /100 | #163 | Good 23.2% |
| Sierra Leoneans | 60.9 /100 | #164 | Good 23.2% |