Subsaharan African vs Bulgarian Disability Age 65 to 74
COMPARE
Subsaharan African
Bulgarian
Disability Age 65 to 74
Disability Age 65 to 74 Comparison
Sub-Saharan Africans
Bulgarians
25.1%
DISABILITY AGE 65 TO 74
0.6/ 100
METRIC RATING
253rd/ 347
METRIC RANK
21.1%
DISABILITY AGE 65 TO 74
99.9/ 100
METRIC RATING
35th/ 347
METRIC RANK
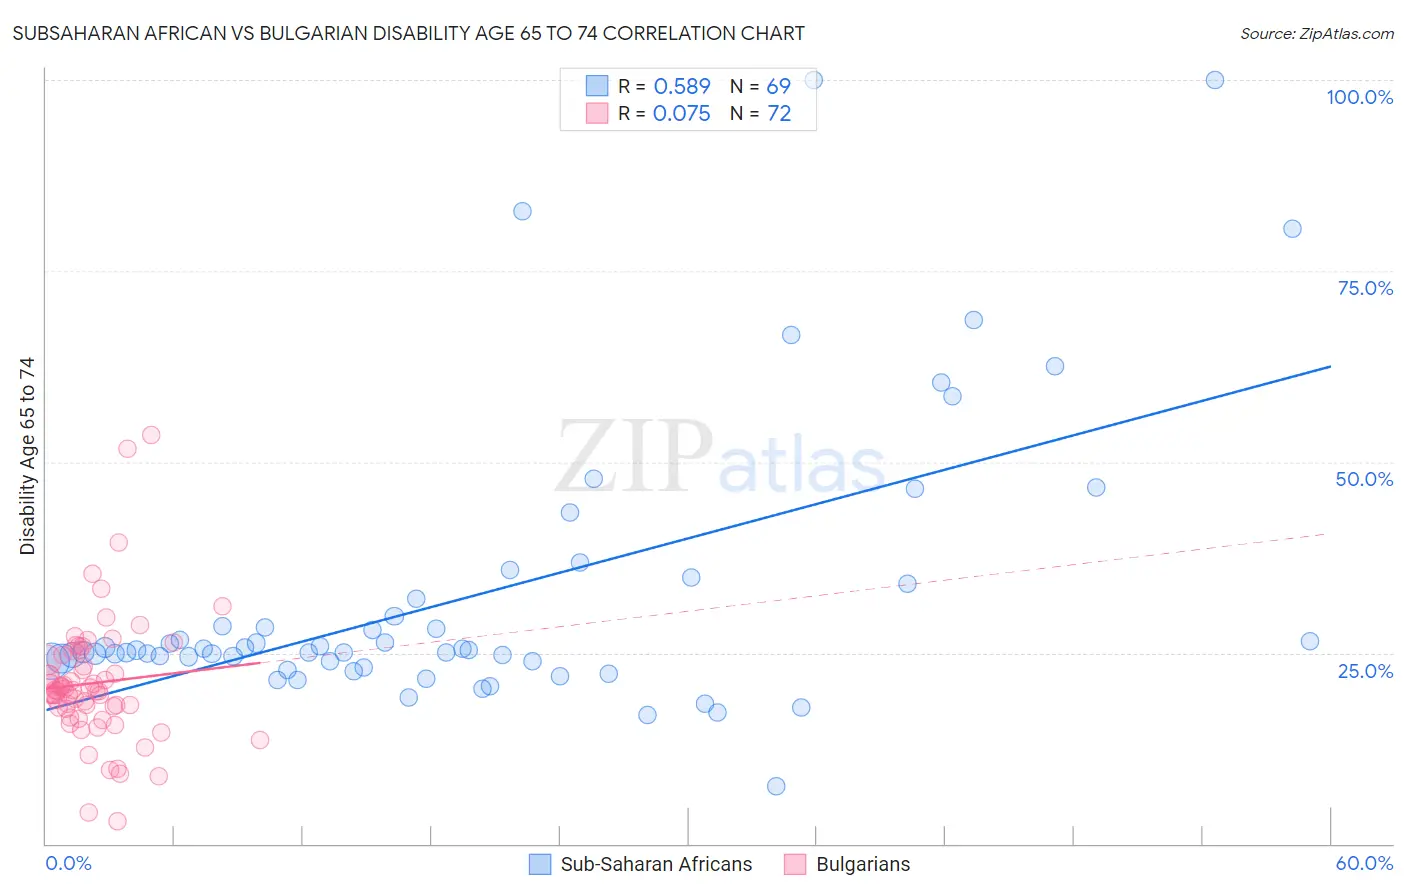
Subsaharan African vs Bulgarian Disability Age 65 to 74 Correlation Chart
The statistical analysis conducted on geographies consisting of 506,486,159 people shows a substantial positive correlation between the proportion of Sub-Saharan Africans and percentage of population with a disability between the ages 65 and 75 in the United States with a correlation coefficient (R) of 0.589 and weighted average of 25.1%. Similarly, the statistical analysis conducted on geographies consisting of 205,498,287 people shows a slight positive correlation between the proportion of Bulgarians and percentage of population with a disability between the ages 65 and 75 in the United States with a correlation coefficient (R) of 0.075 and weighted average of 21.1%, a difference of 18.9%.
Disability Age 65 to 74 Correlation Summary
| Measurement | Subsaharan African | Bulgarian |
| Minimum | 7.5% | 2.9% |
| Maximum | 100.0% | 53.5% |
| Range | 92.5% | 50.5% |
| Mean | 32.6% | 21.0% |
| Median | 25.4% | 20.1% |
| Interquartile 25% (IQ1) | 23.9% | 17.8% |
| Interquartile 75% (IQ3) | 33.0% | 24.4% |
| Interquartile Range (IQR) | 9.1% | 6.6% |
| Standard Deviation (Sample) | 18.8% | 8.3% |
| Standard Deviation (Population) | 18.7% | 8.2% |
Similar Demographics by Disability Age 65 to 74
Demographics Similar to Sub-Saharan Africans by Disability Age 65 to 74
In terms of disability age 65 to 74, the demographic groups most similar to Sub-Saharan Africans are Immigrants from El Salvador (25.1%, a difference of 0.030%), Somali (25.1%, a difference of 0.080%), Nonimmigrants (25.0%, a difference of 0.23%), Central American (25.1%, a difference of 0.23%), and Salvadoran (25.0%, a difference of 0.43%).
| Demographics | Rating | Rank | Disability Age 65 to 74 |
| Immigrants | Iraq | 1.9 /100 | #246 | Tragic 24.7% |
| Indonesians | 1.1 /100 | #247 | Tragic 24.9% |
| Senegalese | 0.9 /100 | #248 | Tragic 24.9% |
| Immigrants | Fiji | 0.8 /100 | #249 | Tragic 25.0% |
| Salvadorans | 0.8 /100 | #250 | Tragic 25.0% |
| Immigrants | Nonimmigrants | 0.7 /100 | #251 | Tragic 25.0% |
| Immigrants | El Salvador | 0.6 /100 | #252 | Tragic 25.1% |
| Sub-Saharan Africans | 0.6 /100 | #253 | Tragic 25.1% |
| Somalis | 0.6 /100 | #254 | Tragic 25.1% |
| Central Americans | 0.5 /100 | #255 | Tragic 25.1% |
| Immigrants | Somalia | 0.4 /100 | #256 | Tragic 25.2% |
| Guamanians/Chamorros | 0.3 /100 | #257 | Tragic 25.3% |
| Marshallese | 0.3 /100 | #258 | Tragic 25.3% |
| Immigrants | Cambodia | 0.3 /100 | #259 | Tragic 25.3% |
| Malaysians | 0.2 /100 | #260 | Tragic 25.4% |
Demographics Similar to Bulgarians by Disability Age 65 to 74
In terms of disability age 65 to 74, the demographic groups most similar to Bulgarians are Immigrants from Sri Lanka (21.1%, a difference of 0.050%), Immigrants from Argentina (21.1%, a difference of 0.090%), Immigrants from Switzerland (21.1%, a difference of 0.19%), Turkish (21.0%, a difference of 0.29%), and Israeli (21.2%, a difference of 0.30%).
| Demographics | Rating | Rank | Disability Age 65 to 74 |
| Immigrants | Czechoslovakia | 99.9 /100 | #28 | Exceptional 21.0% |
| Immigrants | Japan | 99.9 /100 | #29 | Exceptional 21.0% |
| Immigrants | Greece | 99.9 /100 | #30 | Exceptional 21.0% |
| Immigrants | Northern Europe | 99.9 /100 | #31 | Exceptional 21.0% |
| Turks | 99.9 /100 | #32 | Exceptional 21.0% |
| Immigrants | Argentina | 99.9 /100 | #33 | Exceptional 21.1% |
| Immigrants | Sri Lanka | 99.9 /100 | #34 | Exceptional 21.1% |
| Bulgarians | 99.9 /100 | #35 | Exceptional 21.1% |
| Immigrants | Switzerland | 99.8 /100 | #36 | Exceptional 21.1% |
| Israelis | 99.8 /100 | #37 | Exceptional 21.2% |
| Russians | 99.8 /100 | #38 | Exceptional 21.2% |
| Argentineans | 99.8 /100 | #39 | Exceptional 21.2% |
| Latvians | 99.8 /100 | #40 | Exceptional 21.2% |
| Immigrants | Austria | 99.8 /100 | #41 | Exceptional 21.2% |
| Macedonians | 99.7 /100 | #42 | Exceptional 21.3% |