Subsaharan African vs Nicaraguan Disability Age 65 to 74
COMPARE
Subsaharan African
Nicaraguan
Disability Age 65 to 74
Disability Age 65 to 74 Comparison
Sub-Saharan Africans
Nicaraguans
25.1%
DISABILITY AGE 65 TO 74
0.6/ 100
METRIC RATING
253rd/ 347
METRIC RANK
23.9%
DISABILITY AGE 65 TO 74
14.3/ 100
METRIC RATING
213th/ 347
METRIC RANK
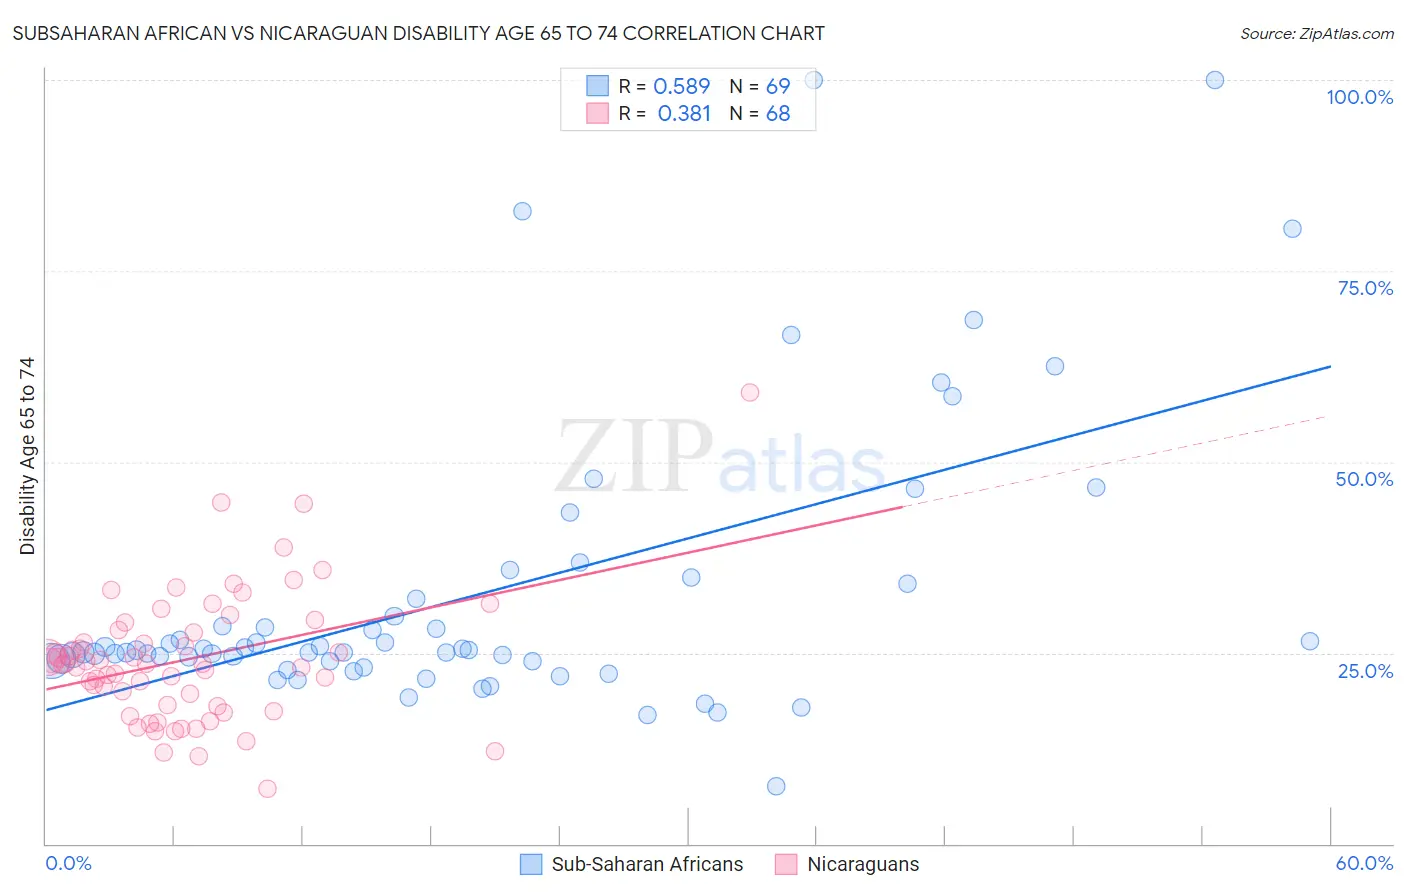
Subsaharan African vs Nicaraguan Disability Age 65 to 74 Correlation Chart
The statistical analysis conducted on geographies consisting of 506,486,159 people shows a substantial positive correlation between the proportion of Sub-Saharan Africans and percentage of population with a disability between the ages 65 and 75 in the United States with a correlation coefficient (R) of 0.589 and weighted average of 25.1%. Similarly, the statistical analysis conducted on geographies consisting of 285,318,687 people shows a mild positive correlation between the proportion of Nicaraguans and percentage of population with a disability between the ages 65 and 75 in the United States with a correlation coefficient (R) of 0.381 and weighted average of 23.9%, a difference of 4.7%.
Disability Age 65 to 74 Correlation Summary
| Measurement | Subsaharan African | Nicaraguan |
| Minimum | 7.5% | 7.2% |
| Maximum | 100.0% | 59.1% |
| Range | 92.5% | 52.0% |
| Mean | 32.6% | 24.1% |
| Median | 25.4% | 23.5% |
| Interquartile 25% (IQ1) | 23.9% | 18.0% |
| Interquartile 75% (IQ3) | 33.0% | 27.8% |
| Interquartile Range (IQR) | 9.1% | 9.8% |
| Standard Deviation (Sample) | 18.8% | 8.6% |
| Standard Deviation (Population) | 18.7% | 8.5% |
Similar Demographics by Disability Age 65 to 74
Demographics Similar to Sub-Saharan Africans by Disability Age 65 to 74
In terms of disability age 65 to 74, the demographic groups most similar to Sub-Saharan Africans are Immigrants from El Salvador (25.1%, a difference of 0.030%), Somali (25.1%, a difference of 0.080%), Nonimmigrants (25.0%, a difference of 0.23%), Central American (25.1%, a difference of 0.23%), and Salvadoran (25.0%, a difference of 0.43%).
| Demographics | Rating | Rank | Disability Age 65 to 74 |
| Immigrants | Iraq | 1.9 /100 | #246 | Tragic 24.7% |
| Indonesians | 1.1 /100 | #247 | Tragic 24.9% |
| Senegalese | 0.9 /100 | #248 | Tragic 24.9% |
| Immigrants | Fiji | 0.8 /100 | #249 | Tragic 25.0% |
| Salvadorans | 0.8 /100 | #250 | Tragic 25.0% |
| Immigrants | Nonimmigrants | 0.7 /100 | #251 | Tragic 25.0% |
| Immigrants | El Salvador | 0.6 /100 | #252 | Tragic 25.1% |
| Sub-Saharan Africans | 0.6 /100 | #253 | Tragic 25.1% |
| Somalis | 0.6 /100 | #254 | Tragic 25.1% |
| Central Americans | 0.5 /100 | #255 | Tragic 25.1% |
| Immigrants | Somalia | 0.4 /100 | #256 | Tragic 25.2% |
| Guamanians/Chamorros | 0.3 /100 | #257 | Tragic 25.3% |
| Marshallese | 0.3 /100 | #258 | Tragic 25.3% |
| Immigrants | Cambodia | 0.3 /100 | #259 | Tragic 25.3% |
| Malaysians | 0.2 /100 | #260 | Tragic 25.4% |
Demographics Similar to Nicaraguans by Disability Age 65 to 74
In terms of disability age 65 to 74, the demographic groups most similar to Nicaraguans are Immigrants from Oceania (24.0%, a difference of 0.080%), Pennsylvania German (24.0%, a difference of 0.12%), French (23.9%, a difference of 0.16%), Immigrants from West Indies (23.9%, a difference of 0.19%), and Trinidadian and Tobagonian (23.9%, a difference of 0.23%).
| Demographics | Rating | Rank | Disability Age 65 to 74 |
| Immigrants | Jamaica | 20.7 /100 | #206 | Fair 23.8% |
| Immigrants | Sudan | 20.1 /100 | #207 | Fair 23.8% |
| Immigrants | Barbados | 19.6 /100 | #208 | Poor 23.8% |
| Immigrants | Kenya | 19.6 /100 | #209 | Poor 23.8% |
| Trinidadians and Tobagonians | 16.4 /100 | #210 | Poor 23.9% |
| Immigrants | West Indies | 15.9 /100 | #211 | Poor 23.9% |
| French | 15.7 /100 | #212 | Poor 23.9% |
| Nicaraguans | 14.3 /100 | #213 | Poor 23.9% |
| Immigrants | Oceania | 13.6 /100 | #214 | Poor 24.0% |
| Pennsylvania Germans | 13.3 /100 | #215 | Poor 24.0% |
| Jamaicans | 12.2 /100 | #216 | Poor 24.0% |
| Immigrants | Portugal | 11.7 /100 | #217 | Poor 24.0% |
| Immigrants | Nigeria | 11.7 /100 | #218 | Poor 24.0% |
| Immigrants | Burma/Myanmar | 11.6 /100 | #219 | Poor 24.0% |
| Ghanaians | 10.4 /100 | #220 | Poor 24.1% |