Subsaharan African vs Houma Disability Age 65 to 74
COMPARE
Subsaharan African
Houma
Disability Age 65 to 74
Disability Age 65 to 74 Comparison
Sub-Saharan Africans
Houma
25.1%
DISABILITY AGE 65 TO 74
0.6/ 100
METRIC RATING
253rd/ 347
METRIC RANK
32.3%
DISABILITY AGE 65 TO 74
0.0/ 100
METRIC RATING
337th/ 347
METRIC RANK
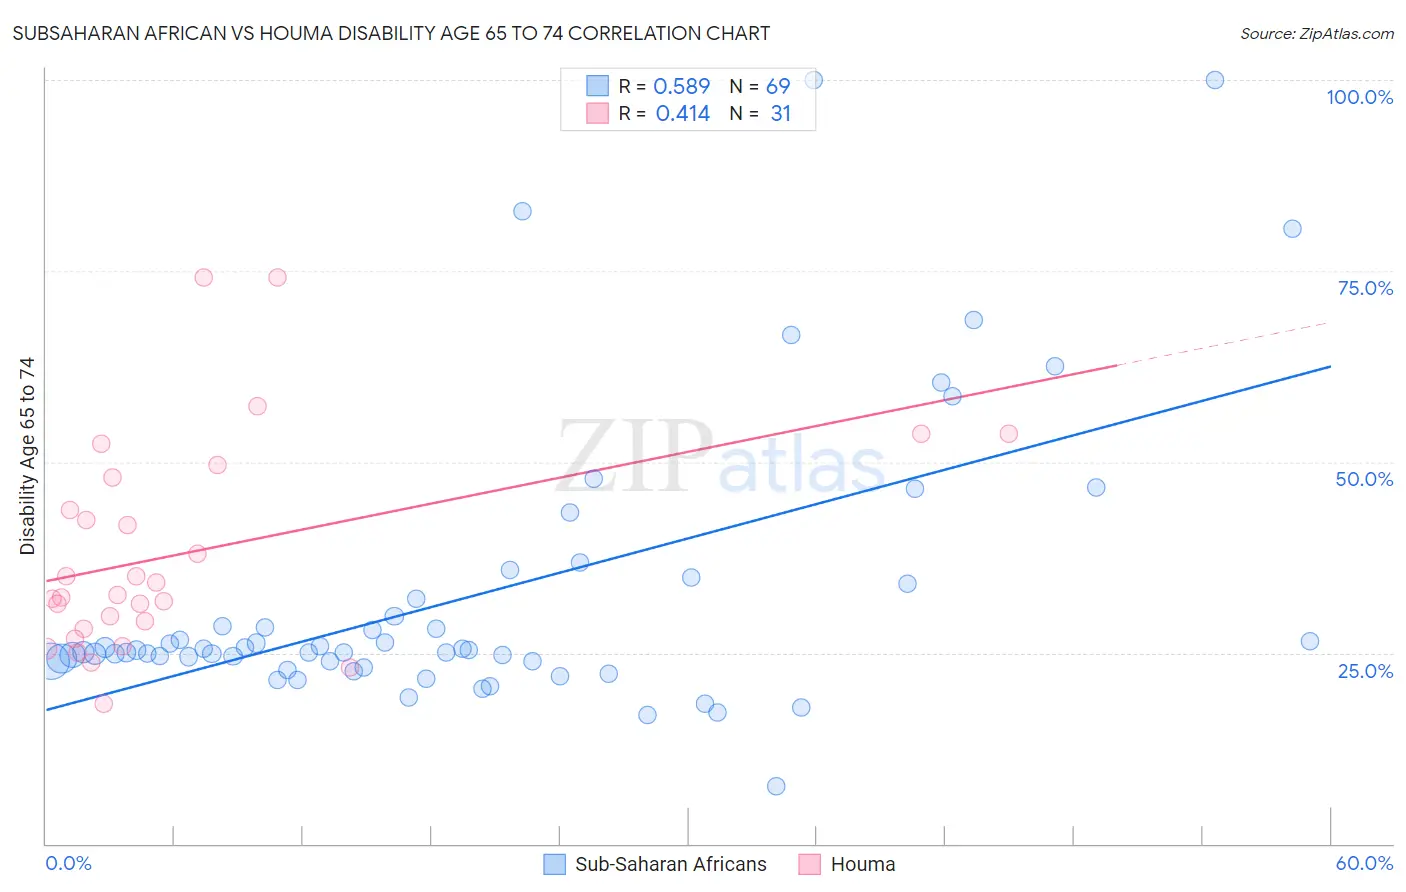
Subsaharan African vs Houma Disability Age 65 to 74 Correlation Chart
The statistical analysis conducted on geographies consisting of 506,486,159 people shows a substantial positive correlation between the proportion of Sub-Saharan Africans and percentage of population with a disability between the ages 65 and 75 in the United States with a correlation coefficient (R) of 0.589 and weighted average of 25.1%. Similarly, the statistical analysis conducted on geographies consisting of 36,769,608 people shows a moderate positive correlation between the proportion of Houma and percentage of population with a disability between the ages 65 and 75 in the United States with a correlation coefficient (R) of 0.414 and weighted average of 32.3%, a difference of 28.8%.
Disability Age 65 to 74 Correlation Summary
| Measurement | Subsaharan African | Houma |
| Minimum | 7.5% | 18.4% |
| Maximum | 100.0% | 74.2% |
| Range | 92.5% | 55.8% |
| Mean | 32.6% | 38.1% |
| Median | 25.4% | 32.5% |
| Interquartile 25% (IQ1) | 23.9% | 28.1% |
| Interquartile 75% (IQ3) | 33.0% | 47.9% |
| Interquartile Range (IQR) | 9.1% | 19.8% |
| Standard Deviation (Sample) | 18.8% | 14.0% |
| Standard Deviation (Population) | 18.7% | 13.8% |
Similar Demographics by Disability Age 65 to 74
Demographics Similar to Sub-Saharan Africans by Disability Age 65 to 74
In terms of disability age 65 to 74, the demographic groups most similar to Sub-Saharan Africans are Immigrants from El Salvador (25.1%, a difference of 0.030%), Somali (25.1%, a difference of 0.080%), Nonimmigrants (25.0%, a difference of 0.23%), Central American (25.1%, a difference of 0.23%), and Salvadoran (25.0%, a difference of 0.43%).
| Demographics | Rating | Rank | Disability Age 65 to 74 |
| Immigrants | Iraq | 1.9 /100 | #246 | Tragic 24.7% |
| Indonesians | 1.1 /100 | #247 | Tragic 24.9% |
| Senegalese | 0.9 /100 | #248 | Tragic 24.9% |
| Immigrants | Fiji | 0.8 /100 | #249 | Tragic 25.0% |
| Salvadorans | 0.8 /100 | #250 | Tragic 25.0% |
| Immigrants | Nonimmigrants | 0.7 /100 | #251 | Tragic 25.0% |
| Immigrants | El Salvador | 0.6 /100 | #252 | Tragic 25.1% |
| Sub-Saharan Africans | 0.6 /100 | #253 | Tragic 25.1% |
| Somalis | 0.6 /100 | #254 | Tragic 25.1% |
| Central Americans | 0.5 /100 | #255 | Tragic 25.1% |
| Immigrants | Somalia | 0.4 /100 | #256 | Tragic 25.2% |
| Guamanians/Chamorros | 0.3 /100 | #257 | Tragic 25.3% |
| Marshallese | 0.3 /100 | #258 | Tragic 25.3% |
| Immigrants | Cambodia | 0.3 /100 | #259 | Tragic 25.3% |
| Malaysians | 0.2 /100 | #260 | Tragic 25.4% |
Demographics Similar to Houma by Disability Age 65 to 74
In terms of disability age 65 to 74, the demographic groups most similar to Houma are Alaskan Athabascan (32.4%, a difference of 0.19%), Kiowa (32.6%, a difference of 0.81%), Lumbee (32.7%, a difference of 1.3%), Tsimshian (32.9%, a difference of 1.9%), and Pueblo (33.1%, a difference of 2.5%).
| Demographics | Rating | Rank | Disability Age 65 to 74 |
| Creek | 0.0 /100 | #330 | Tragic 30.2% |
| Chickasaw | 0.0 /100 | #331 | Tragic 30.2% |
| Natives/Alaskans | 0.0 /100 | #332 | Tragic 30.4% |
| Colville | 0.0 /100 | #333 | Tragic 30.5% |
| Alaska Natives | 0.0 /100 | #334 | Tragic 30.6% |
| Cheyenne | 0.0 /100 | #335 | Tragic 31.1% |
| Yuman | 0.0 /100 | #336 | Tragic 31.5% |
| Houma | 0.0 /100 | #337 | Tragic 32.3% |
| Alaskan Athabascans | 0.0 /100 | #338 | Tragic 32.4% |
| Kiowa | 0.0 /100 | #339 | Tragic 32.6% |
| Lumbee | 0.0 /100 | #340 | Tragic 32.7% |
| Tsimshian | 0.0 /100 | #341 | Tragic 32.9% |
| Pueblo | 0.0 /100 | #342 | Tragic 33.1% |
| Navajo | 0.0 /100 | #343 | Tragic 33.3% |
| Inupiat | 0.0 /100 | #344 | Tragic 34.5% |