Subsaharan African vs Czechoslovakian 10th Grade
COMPARE
Subsaharan African
Czechoslovakian
10th Grade
10th Grade Comparison
Sub-Saharan Africans
Czechoslovakians
93.1%
10TH GRADE
4.7/ 100
METRIC RATING
234th/ 347
METRIC RANK
95.1%
10TH GRADE
99.9/ 100
METRIC RATING
46th/ 347
METRIC RANK
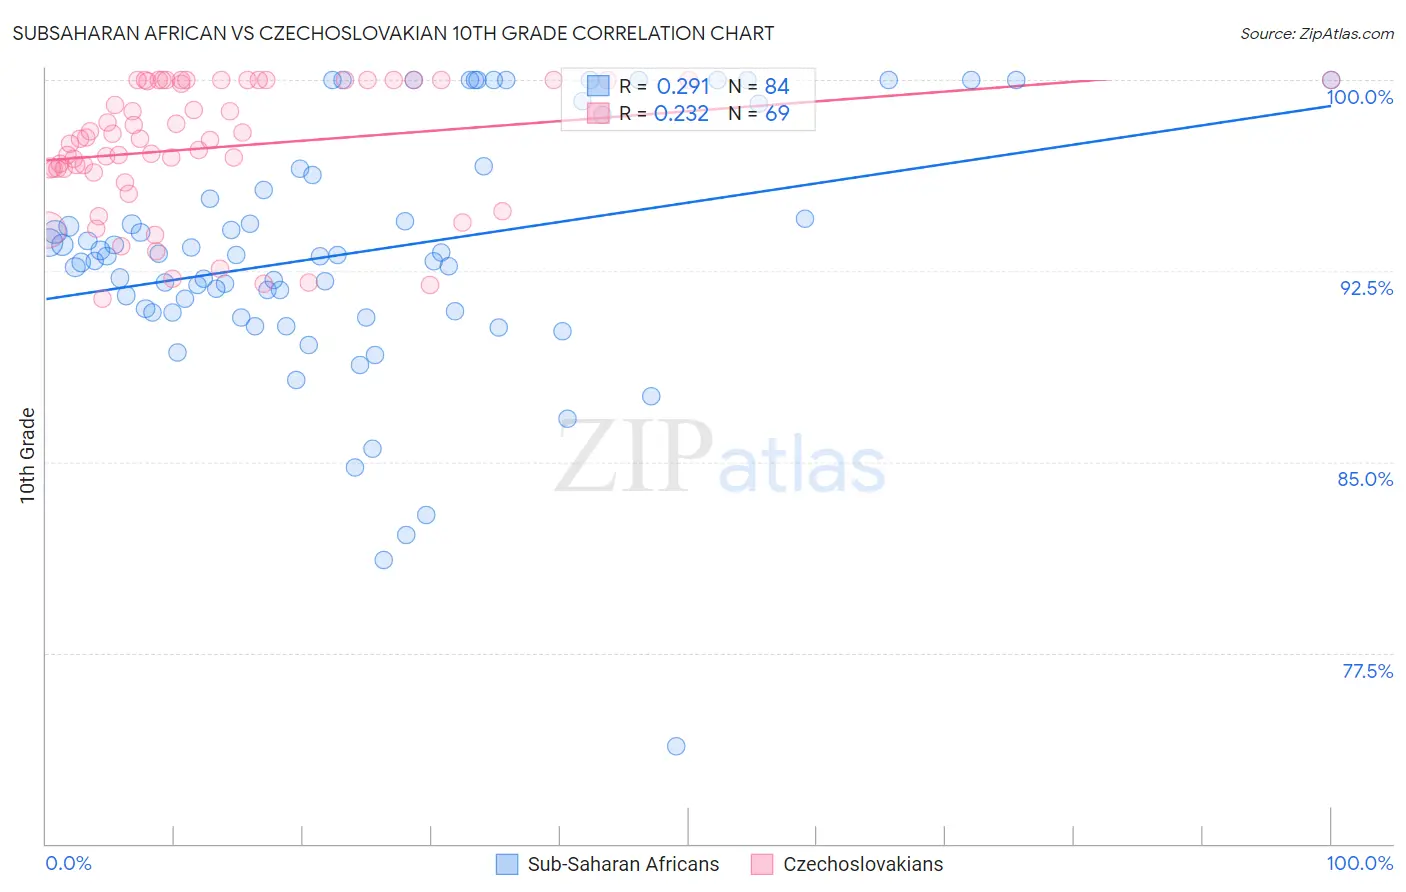
Subsaharan African vs Czechoslovakian 10th Grade Correlation Chart
The statistical analysis conducted on geographies consisting of 508,219,008 people shows a weak positive correlation between the proportion of Sub-Saharan Africans and percentage of population with at least 10th grade education in the United States with a correlation coefficient (R) of 0.291 and weighted average of 93.1%. Similarly, the statistical analysis conducted on geographies consisting of 368,668,876 people shows a weak positive correlation between the proportion of Czechoslovakians and percentage of population with at least 10th grade education in the United States with a correlation coefficient (R) of 0.232 and weighted average of 95.1%, a difference of 2.2%.
10th Grade Correlation Summary
| Measurement | Subsaharan African | Czechoslovakian |
| Minimum | 73.8% | 91.4% |
| Maximum | 100.0% | 100.0% |
| Range | 26.2% | 8.6% |
| Mean | 93.3% | 97.4% |
| Median | 93.1% | 97.7% |
| Interquartile 25% (IQ1) | 90.9% | 96.4% |
| Interquartile 75% (IQ3) | 96.4% | 100.0% |
| Interquartile Range (IQR) | 5.5% | 3.6% |
| Standard Deviation (Sample) | 4.9% | 2.5% |
| Standard Deviation (Population) | 4.9% | 2.5% |
Similar Demographics by 10th Grade
Demographics Similar to Sub-Saharan Africans by 10th Grade
In terms of 10th grade, the demographic groups most similar to Sub-Saharan Africans are South American Indian (93.1%, a difference of 0.010%), Bahamian (93.1%, a difference of 0.010%), Comanche (93.1%, a difference of 0.010%), African (93.1%, a difference of 0.010%), and Afghan (93.1%, a difference of 0.010%).
| Demographics | Rating | Rank | 10th Grade |
| Blacks/African Americans | 6.0 /100 | #227 | Tragic 93.2% |
| Immigrants | China | 5.9 /100 | #228 | Tragic 93.2% |
| Immigrants | Ethiopia | 5.1 /100 | #229 | Tragic 93.1% |
| Immigrants | Africa | 5.0 /100 | #230 | Tragic 93.1% |
| South American Indians | 4.9 /100 | #231 | Tragic 93.1% |
| Bahamians | 4.9 /100 | #232 | Tragic 93.1% |
| Comanche | 4.9 /100 | #233 | Tragic 93.1% |
| Sub-Saharan Africans | 4.7 /100 | #234 | Tragic 93.1% |
| Africans | 4.6 /100 | #235 | Tragic 93.1% |
| Afghans | 4.5 /100 | #236 | Tragic 93.1% |
| Immigrants | Panama | 4.3 /100 | #237 | Tragic 93.1% |
| Nigerians | 4.2 /100 | #238 | Tragic 93.1% |
| Costa Ricans | 4.2 /100 | #239 | Tragic 93.1% |
| Immigrants | Hong Kong | 4.2 /100 | #240 | Tragic 93.1% |
| Immigrants | Somalia | 2.7 /100 | #241 | Tragic 93.0% |
Demographics Similar to Czechoslovakians by 10th Grade
In terms of 10th grade, the demographic groups most similar to Czechoslovakians are Immigrants from Northern Europe (95.2%, a difference of 0.010%), Greek (95.2%, a difference of 0.010%), Serbian (95.1%, a difference of 0.010%), Macedonian (95.2%, a difference of 0.020%), and Australian (95.1%, a difference of 0.020%).
| Demographics | Rating | Rank | 10th Grade |
| Immigrants | Scotland | 99.9 /100 | #39 | Exceptional 95.2% |
| Scotch-Irish | 99.9 /100 | #40 | Exceptional 95.2% |
| Russians | 99.9 /100 | #41 | Exceptional 95.2% |
| Slavs | 99.9 /100 | #42 | Exceptional 95.2% |
| Macedonians | 99.9 /100 | #43 | Exceptional 95.2% |
| Immigrants | Northern Europe | 99.9 /100 | #44 | Exceptional 95.2% |
| Greeks | 99.9 /100 | #45 | Exceptional 95.2% |
| Czechoslovakians | 99.9 /100 | #46 | Exceptional 95.1% |
| Serbians | 99.9 /100 | #47 | Exceptional 95.1% |
| Australians | 99.9 /100 | #48 | Exceptional 95.1% |
| Immigrants | Austria | 99.9 /100 | #49 | Exceptional 95.1% |
| Immigrants | Canada | 99.8 /100 | #50 | Exceptional 95.1% |
| Austrians | 99.8 /100 | #51 | Exceptional 95.1% |
| Ottawa | 99.8 /100 | #52 | Exceptional 95.1% |
| Immigrants | North America | 99.8 /100 | #53 | Exceptional 95.0% |