Subsaharan African vs Czech Disability Age 65 to 74
COMPARE
Subsaharan African
Czech
Disability Age 65 to 74
Disability Age 65 to 74 Comparison
Sub-Saharan Africans
Czechs
25.1%
DISABILITY AGE 65 TO 74
0.6/ 100
METRIC RATING
253rd/ 347
METRIC RANK
22.4%
DISABILITY AGE 65 TO 74
93.5/ 100
METRIC RATING
121st/ 347
METRIC RANK
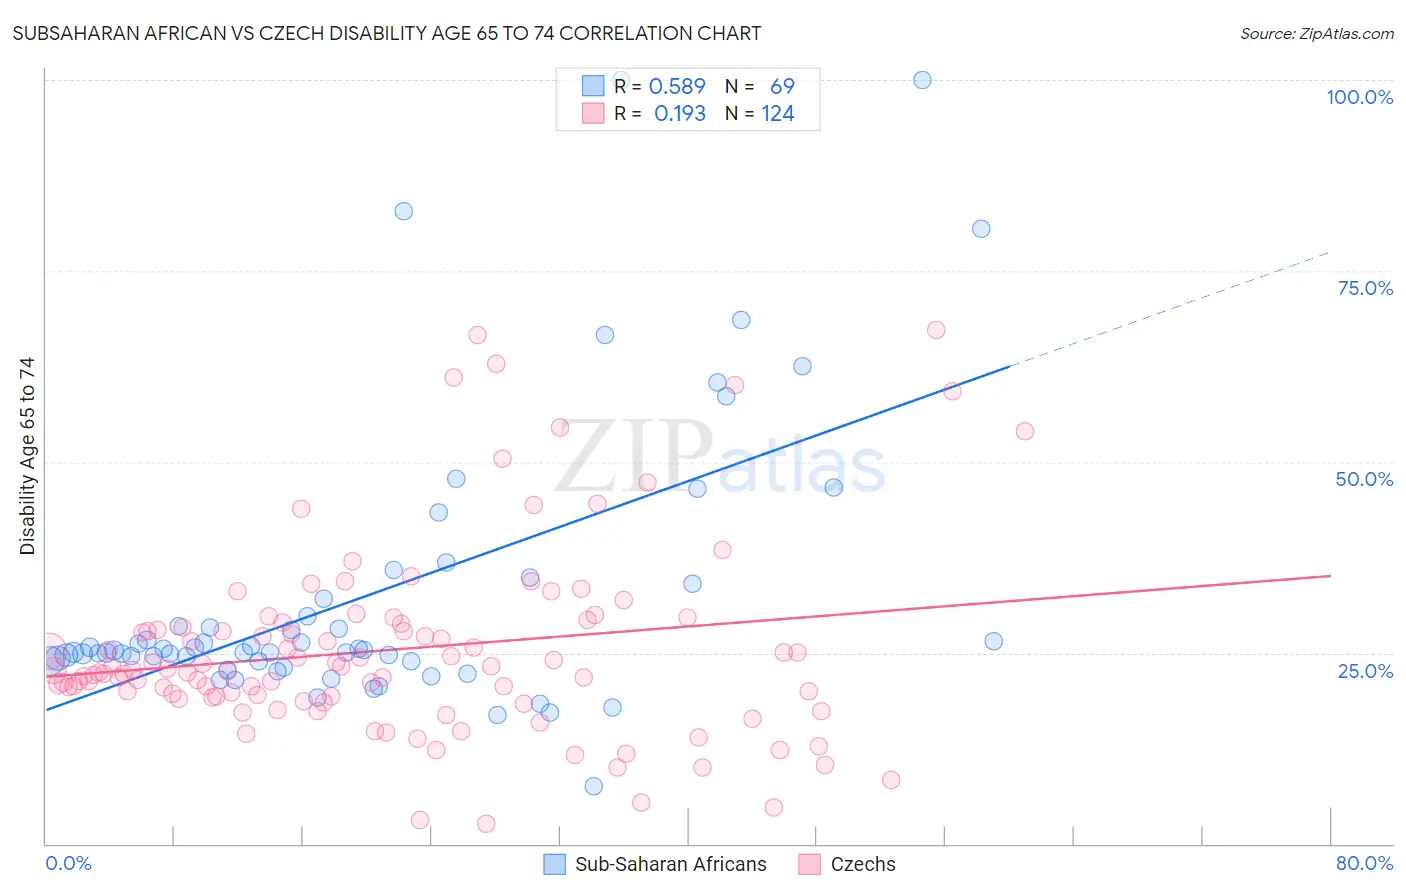
Subsaharan African vs Czech Disability Age 65 to 74 Correlation Chart
The statistical analysis conducted on geographies consisting of 506,486,159 people shows a substantial positive correlation between the proportion of Sub-Saharan Africans and percentage of population with a disability between the ages 65 and 75 in the United States with a correlation coefficient (R) of 0.589 and weighted average of 25.1%. Similarly, the statistical analysis conducted on geographies consisting of 483,519,300 people shows a poor positive correlation between the proportion of Czechs and percentage of population with a disability between the ages 65 and 75 in the United States with a correlation coefficient (R) of 0.193 and weighted average of 22.4%, a difference of 11.8%.
Disability Age 65 to 74 Correlation Summary
| Measurement | Subsaharan African | Czech |
| Minimum | 7.5% | 2.7% |
| Maximum | 100.0% | 67.3% |
| Range | 92.5% | 64.7% |
| Mean | 32.6% | 25.4% |
| Median | 25.4% | 22.6% |
| Interquartile 25% (IQ1) | 23.9% | 19.3% |
| Interquartile 75% (IQ3) | 33.0% | 28.6% |
| Interquartile Range (IQR) | 9.1% | 9.3% |
| Standard Deviation (Sample) | 18.8% | 12.5% |
| Standard Deviation (Population) | 18.7% | 12.4% |
Similar Demographics by Disability Age 65 to 74
Demographics Similar to Sub-Saharan Africans by Disability Age 65 to 74
In terms of disability age 65 to 74, the demographic groups most similar to Sub-Saharan Africans are Immigrants from El Salvador (25.1%, a difference of 0.030%), Somali (25.1%, a difference of 0.080%), Nonimmigrants (25.0%, a difference of 0.23%), Central American (25.1%, a difference of 0.23%), and Salvadoran (25.0%, a difference of 0.43%).
| Demographics | Rating | Rank | Disability Age 65 to 74 |
| Immigrants | Iraq | 1.9 /100 | #246 | Tragic 24.7% |
| Indonesians | 1.1 /100 | #247 | Tragic 24.9% |
| Senegalese | 0.9 /100 | #248 | Tragic 24.9% |
| Immigrants | Fiji | 0.8 /100 | #249 | Tragic 25.0% |
| Salvadorans | 0.8 /100 | #250 | Tragic 25.0% |
| Immigrants | Nonimmigrants | 0.7 /100 | #251 | Tragic 25.0% |
| Immigrants | El Salvador | 0.6 /100 | #252 | Tragic 25.1% |
| Sub-Saharan Africans | 0.6 /100 | #253 | Tragic 25.1% |
| Somalis | 0.6 /100 | #254 | Tragic 25.1% |
| Central Americans | 0.5 /100 | #255 | Tragic 25.1% |
| Immigrants | Somalia | 0.4 /100 | #256 | Tragic 25.2% |
| Guamanians/Chamorros | 0.3 /100 | #257 | Tragic 25.3% |
| Marshallese | 0.3 /100 | #258 | Tragic 25.3% |
| Immigrants | Cambodia | 0.3 /100 | #259 | Tragic 25.3% |
| Malaysians | 0.2 /100 | #260 | Tragic 25.4% |
Demographics Similar to Czechs by Disability Age 65 to 74
In terms of disability age 65 to 74, the demographic groups most similar to Czechs are Immigrants from Jordan (22.4%, a difference of 0.0%), Hungarian (22.4%, a difference of 0.050%), Immigrants from Kazakhstan (22.4%, a difference of 0.10%), Norwegian (22.5%, a difference of 0.24%), and Immigrants from Western Europe (22.5%, a difference of 0.28%).
| Demographics | Rating | Rank | Disability Age 65 to 74 |
| Ukrainians | 95.1 /100 | #114 | Exceptional 22.3% |
| Laotians | 94.9 /100 | #115 | Exceptional 22.3% |
| Brazilians | 94.8 /100 | #116 | Exceptional 22.4% |
| Swedes | 94.7 /100 | #117 | Exceptional 22.4% |
| Austrians | 94.7 /100 | #118 | Exceptional 22.4% |
| Immigrants | Northern Africa | 94.7 /100 | #119 | Exceptional 22.4% |
| Immigrants | Kazakhstan | 93.9 /100 | #120 | Exceptional 22.4% |
| Czechs | 93.5 /100 | #121 | Exceptional 22.4% |
| Immigrants | Jordan | 93.5 /100 | #122 | Exceptional 22.4% |
| Hungarians | 93.3 /100 | #123 | Exceptional 22.4% |
| Norwegians | 92.5 /100 | #124 | Exceptional 22.5% |
| Immigrants | Western Europe | 92.3 /100 | #125 | Exceptional 22.5% |
| Lebanese | 92.2 /100 | #126 | Exceptional 22.5% |
| Slovaks | 91.6 /100 | #127 | Exceptional 22.5% |
| Immigrants | Costa Rica | 90.4 /100 | #128 | Exceptional 22.6% |